Information visualization for diabetes management: A literature review
Abstract
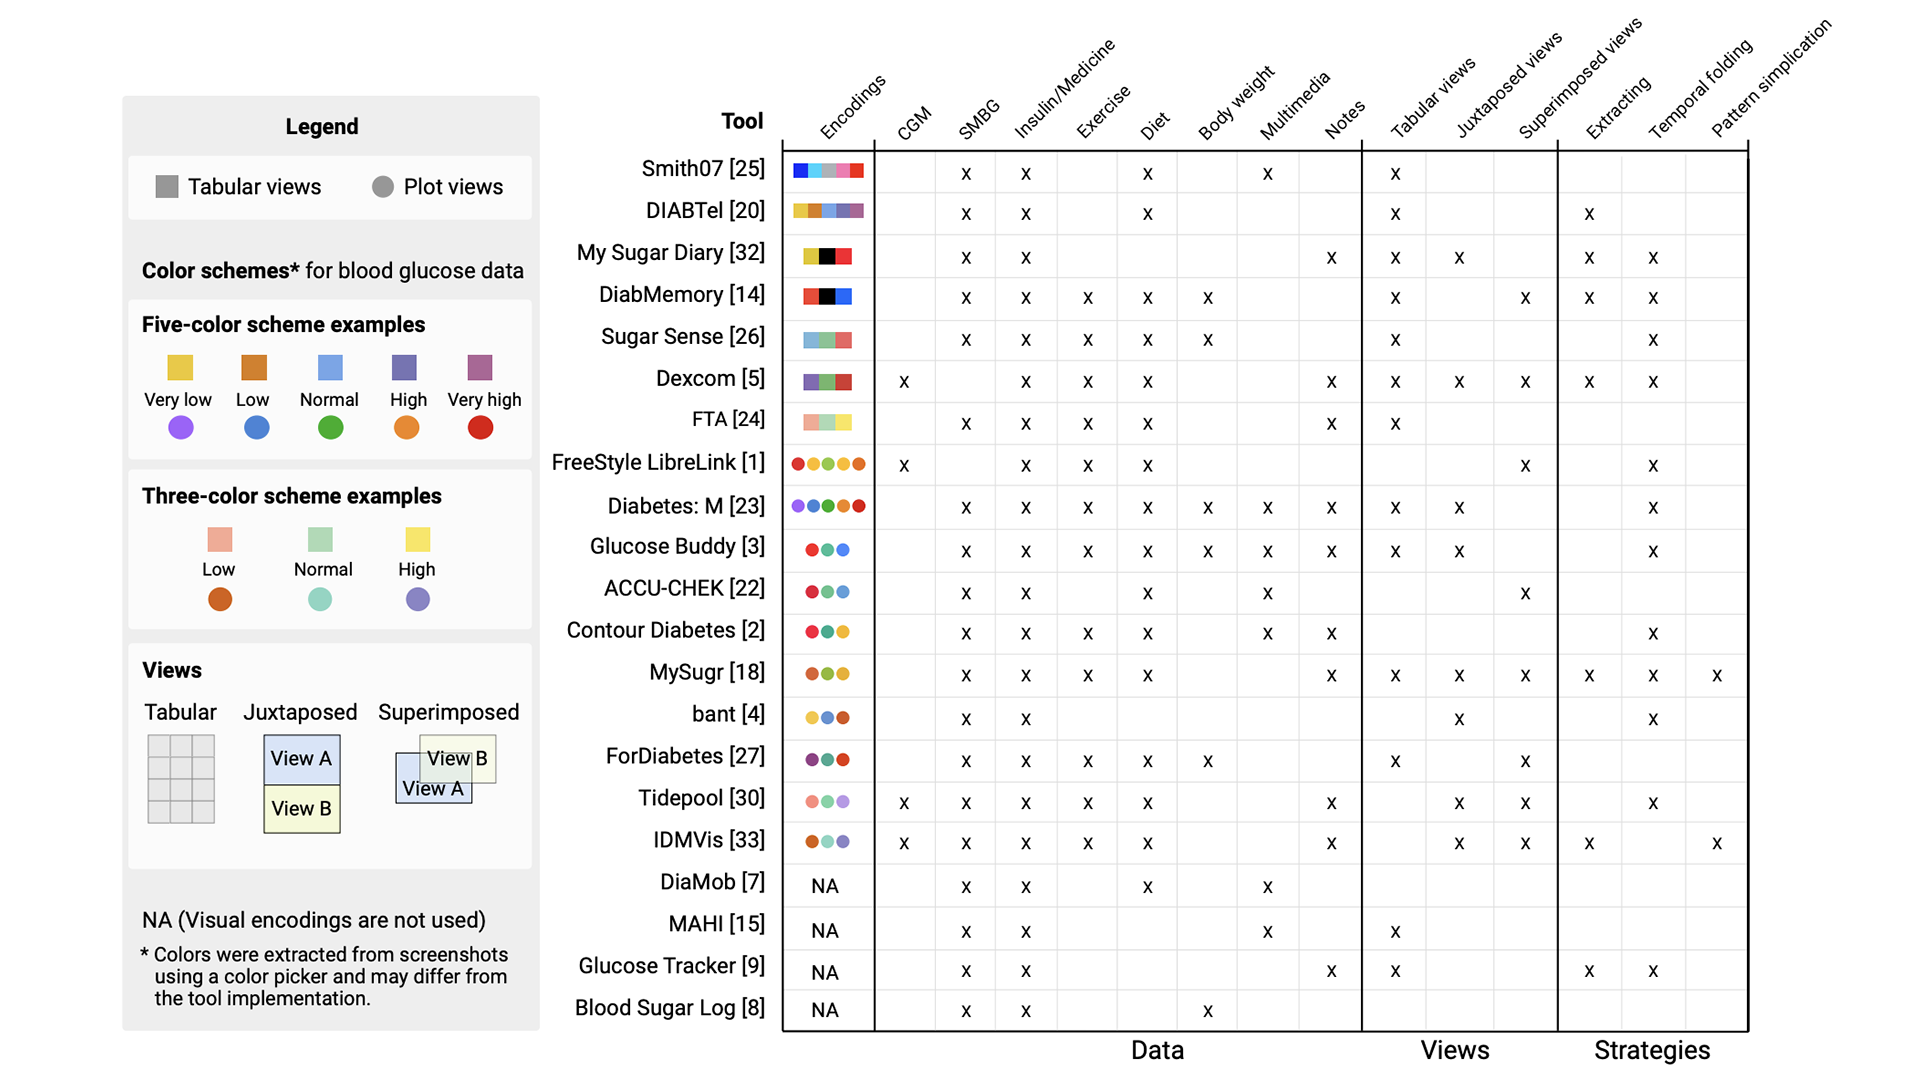
Type 1 diabetes is a chronic illness that affects millions of people. People with type 1 diabetes regularly collect multidimensional data which they use to improve their well-being. Such data often includes blood glucose levels, insulin administration, diet, and physical activity. Monitoring and analysis tools for diabetes care often include information visualizations to help people make sense of this complex data. However, we have only an incomplete understanding of the visualization design approaches used or any justifications for the final design. To address this gap, we surveyed 21 diabetes data analysis tools which use visualization. From this, we derived a design space that consists of data, views, and strategies. We also provide design considerations for future researchers, tool designers, and developers.
Authors


Citation
Information visualization for diabetes management: A literature review
Yixuan Zhang, Andrea G. Parker, and Cody Dunne. Proc. 14th EAI International Conference on Pervasive Computing Technologies for Healthcare—PervasiveHealth. 2020. DOI: 10.1145/3421937.3421957
Khoury Vis Lab — Northeastern University
* West Village H, Room 302, 440 Huntington Ave, Boston, MA 02115, USA
* 100 Fore Street, Portland, ME 04101, USA
* Carnegie Hall, 201, 5000 MacArthur Blvd, Oakland, CA 94613, USA