Home

Data visualizations are designed to leverage the impressive human visual bandwidth so that users can spot clusters, gaps, trends, outliers in the data within a fraction of a second. Visualizations, combined with interaction and animation techniques, can help experts interpret and explore complex data as well as gain confidence in their algorithmic results. Moreover, visualizations are highly effective tools for communicating with other analysts or stakeholders. Research on visualization involves understanding human perception and vision, visual encodings, design thinking, color choice, data simplification, interaction techniques, and animation techniques and designing the next generation of data analysis and communication tools. We have several current research opportunities available for faculty, research scientists, postdoctoral researchers, and students joining our PhD, master's, and bachelor's programs.

Areas of investigation:

  • Perception and cognition
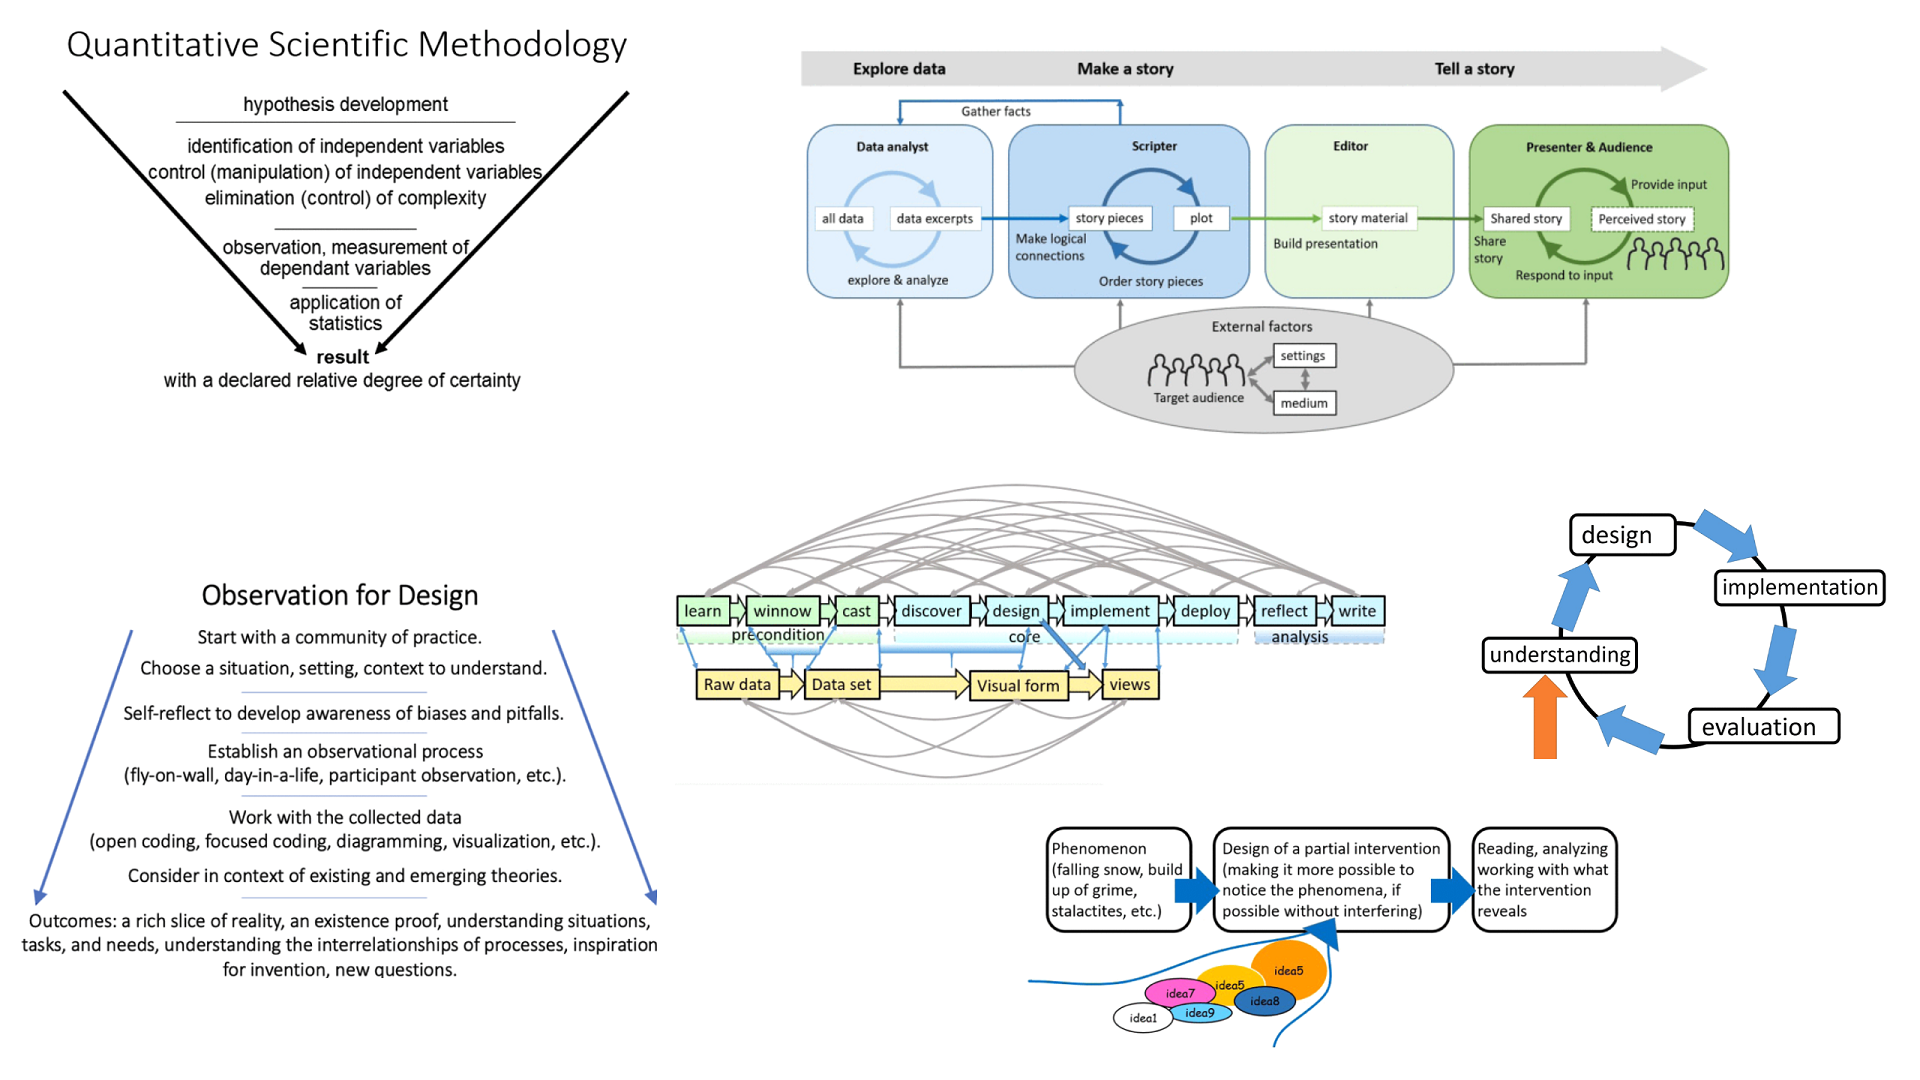
  • Data storytelling
  • Analytic provenance
  • Exploratory data analysis
  • Coordinated views and interactions
  • Tree/hierarchical data
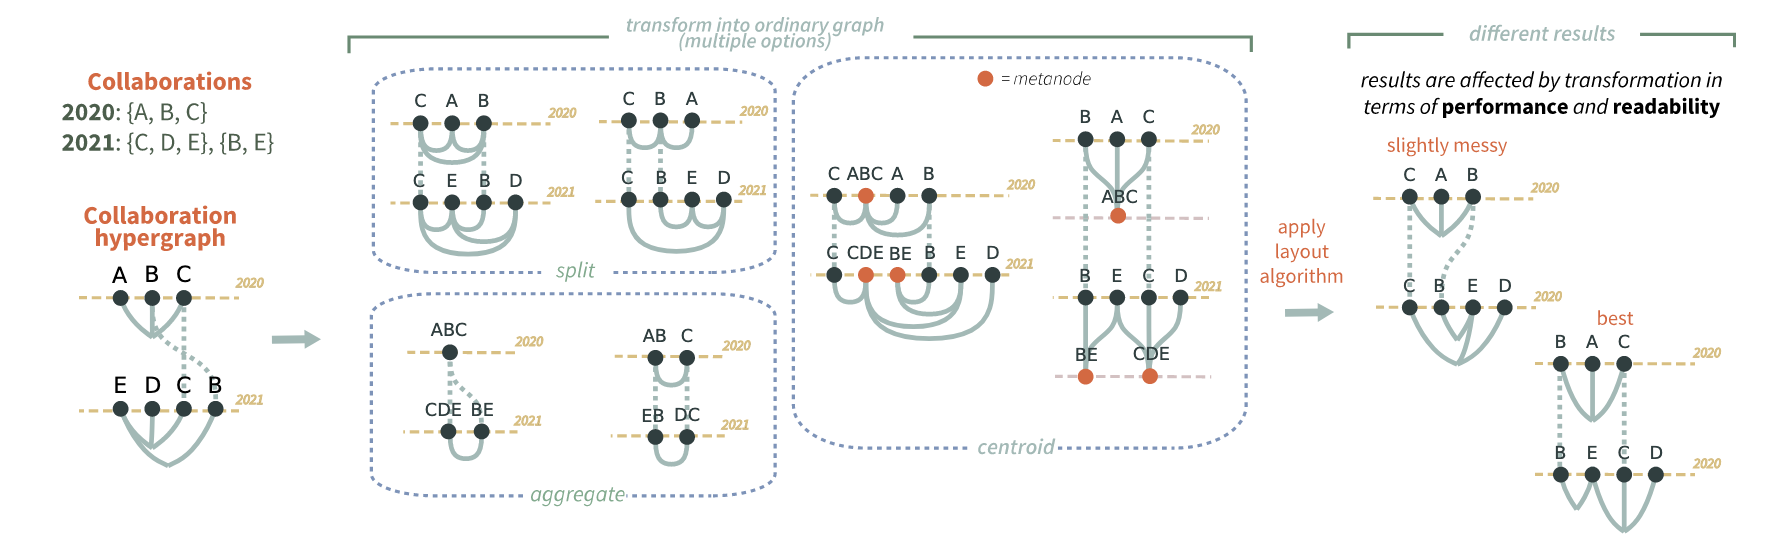
  • Network data
  • Multidimensional data
  • Geospatial data
  • Uncertain, missing, erroneous data
  • Temporal event sequences
  • User interface design
  • Interaction design
  • Evaluation methodologies

Specific domains of interest:

  • Healthcare diagnostic and treatment decision support, including diabetes, neurology, ophthalmology
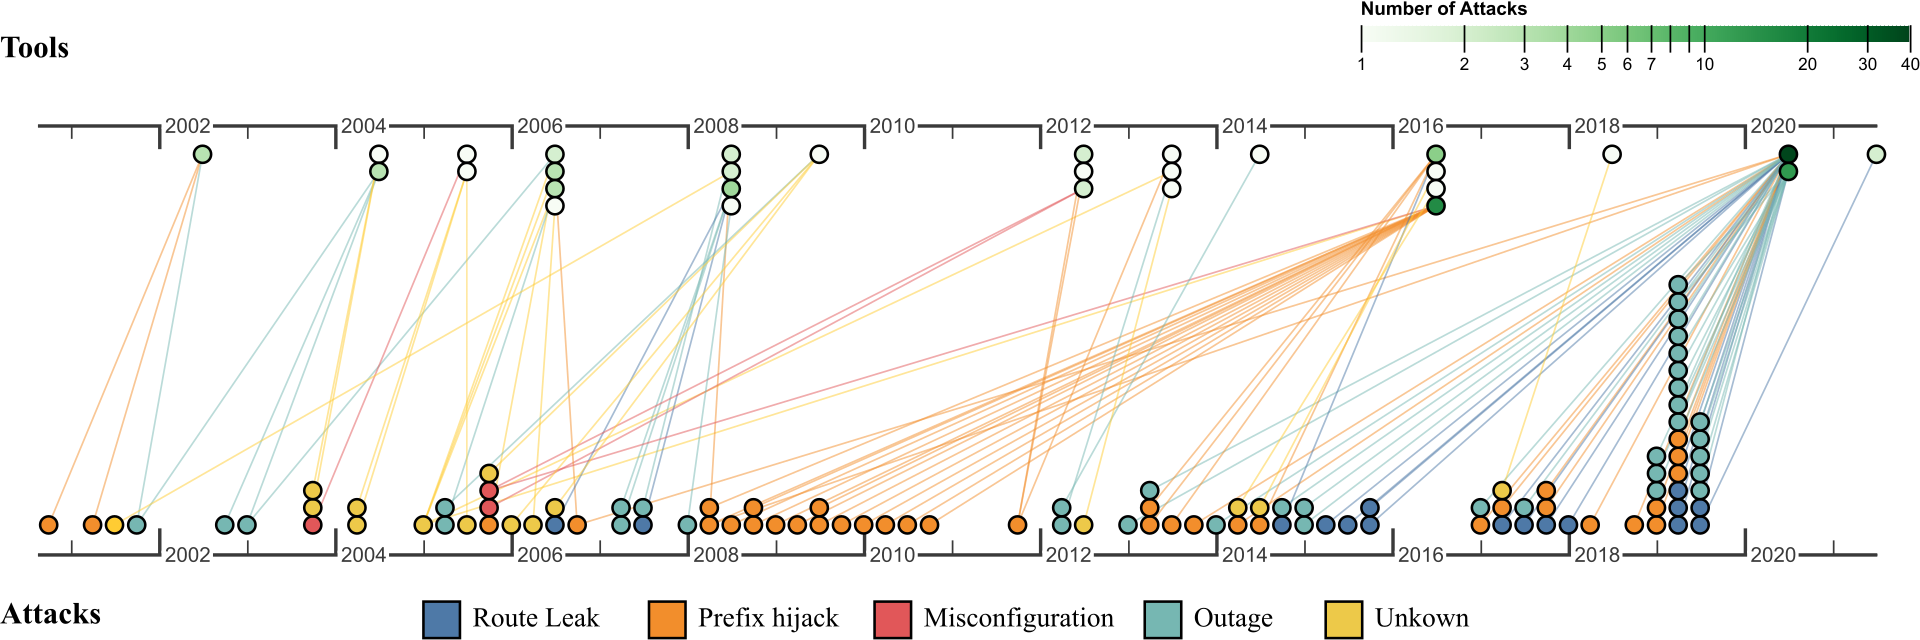
  • Cybersecurity, including unmanned autonomous system analysis
  • Astronomy and physics, including 3D visualization and multidimensional data
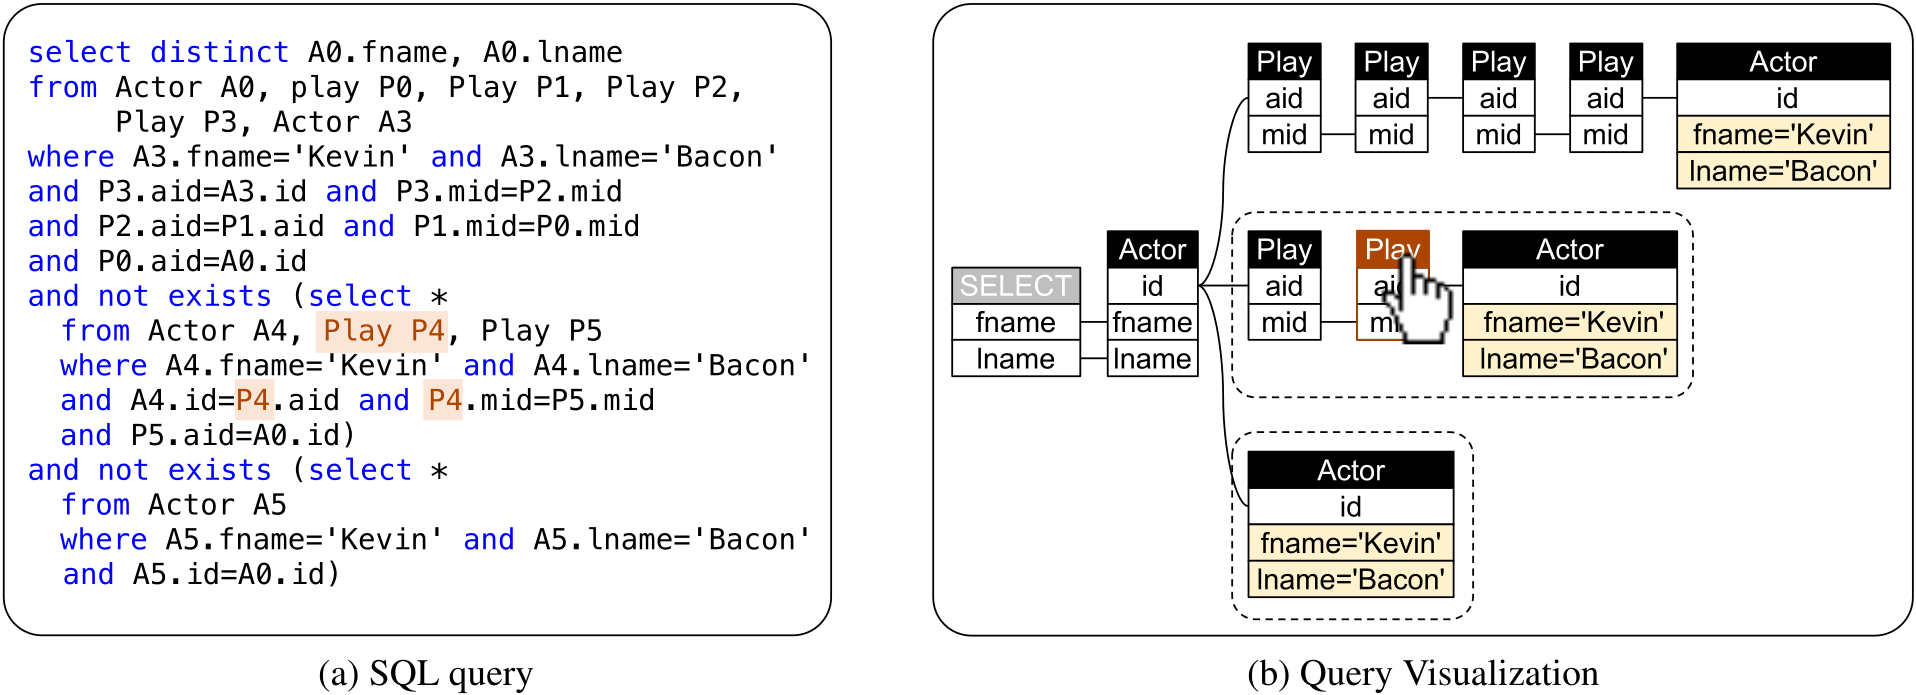
  • Computer Science, including work in databases, programming languages, and systems
  • Digital humanities, including networks of concepts in humanities texts, text and timeline visualizations
  • Epidemiology, including the spread of infectious disease

Recent News

2023-08-08: A bunch of our work will appear at VIS 2023, including two full papers, two short papers (one isn't up yet), a TVCG presentation, a CGA presentation, and two art pieces at VISAP!
2023-07-01: A warm welcome to our newest faculty, Lace Padilla and Michael Correll!
2023-04-13: Khoury will have 27 contributions at CHI 2023, including a paper and two late-breaking works from our group.
2022-09-28: Professor John Alexis Guerra Gomez will be giving an invited talk to Bogota's Major's office on the importance of clean data for visual analytics.
2022-04-15: Welcome to our new PhD students Racquel Fygenson, Eduardo Puerta, Connor Wilson, and Sydney Purdue!

Recent Publications

Thumbnail image for publication titled: SliceLens: guided exploration of machine learning datasets
SliceLens: guided exploration of machine learning datasets

Daniel Kerrigan and Enrico Bertini. Proceedings of the Workshop on Human-In-the-Loop Data Analytics. 2023.

PDF | Preprint | DOI | Code | BibTeX

Thumbnail image for publication titled: Average estimates in line graphs are biased toward areas of higher variability
Average estimates in line graphs are biased toward areas of higher variability

Dominik Moritz, Lace M. Padilla, Francis Nguyen, and Steven L. Franconeri. IEEE Transactions on Visualization and Computer Graphics—VIS/TVCG. 2023.

PDF | Preprint | Supplement | Preregistration | Code | Video preview | Award | BibTeX | Best Paper Honorable Mention

Thumbnail image for publication titled: Augmented reality as a visualization technique for scholarly publications in astronomy: an empirical evaluation
Augmented reality as a visualization technique for scholarly publications in astronomy: an empirical evaluation

Jane L. Adams, Laura South, Arzu Çöltekin, Alyssa Goodman, and Michelle A. Borkin. IEEE Transactions on Visualization and Computer Graphics—VIS/TVCG. 2023.

PDF | Preprint | DOI | Supplement | Preregistration | BibTeX


Data Visualization @ Khoury — Northeastern University
West Village H, Room 302
440 Huntington Ave, Boston, MA 02115, USA