QueryVis: Logic-based diagrams help users understand complicated SQL queries faster
Abstract
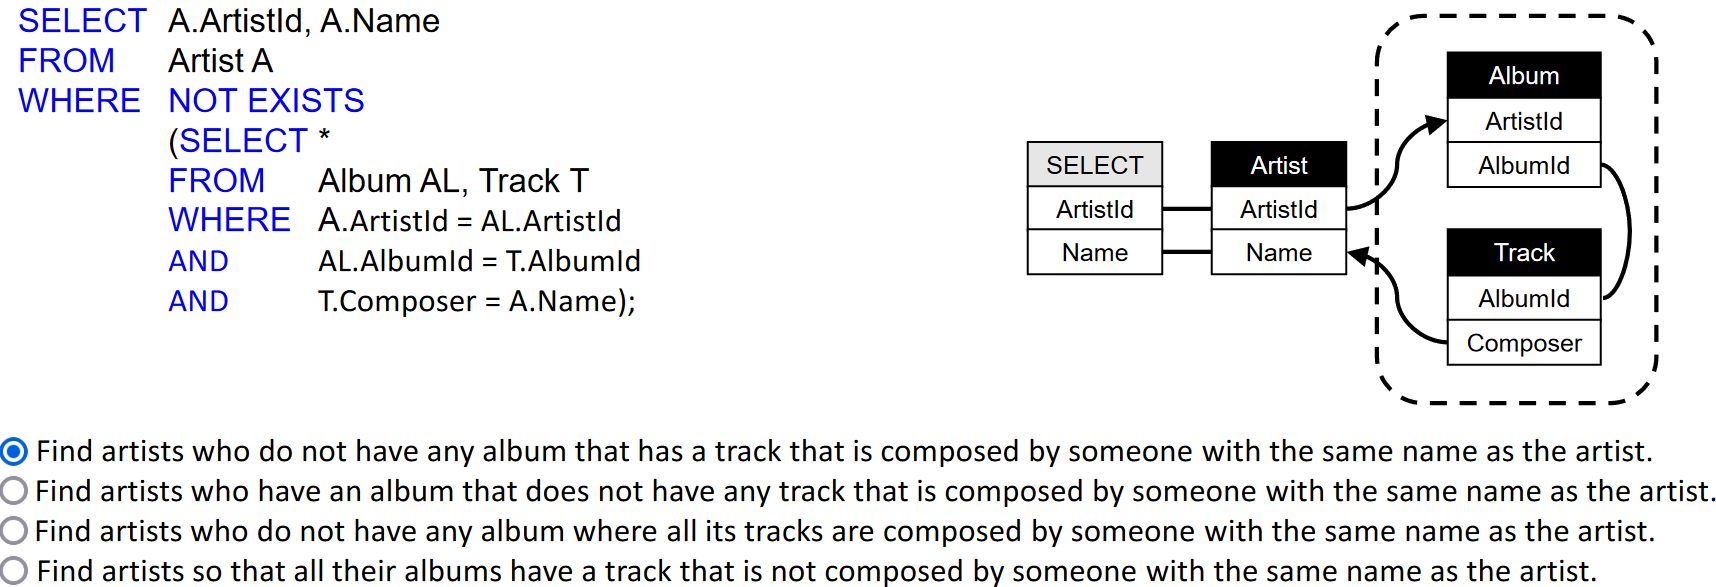
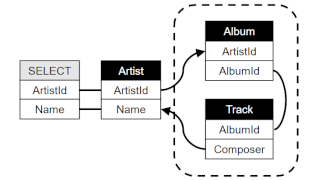
Understanding the meaning of existing SQL queries is critical for code maintenance and reuse. Yet SQL can be hard to read, even for expert users or the original creator of a query. We conjecture that it is possible to capture the logical intent of queries in automatically-generated visual diagrams that can help users understand the meaning of queries faster and more accurately than SQL text alone. We present initial steps in that direction with visual diagrams that are based on the first-order logic foundation of SQL and can capture the meaning of deeply nested queries. Our diagrams build upon a rich history of diagrammatic reasoning systems in logic and were designed using a large body of human-computer interaction best practices: they are minimal in that no visual element is superfluous; they are unambiguous in that no two queries with different semantics map to the same visualization; and they extend previously existing visual representations of relational schemata and conjunctive queries in a natural way. An experimental evaluation involving 42 users on Amazon Mechanical Turk shows that with only a 2–3 minute static tutorial, participants could interpret queries meaningfully faster with our diagrams than when reading SQL alone. Moreover, we have evidence that our visual diagrams result in participants making fewer errors than with SQL. We believe that more regular exposure to diagrammatic representations of SQL can give rise to a pattern-based and thus more intuitive use and re-use of SQL. A full version of this paper with all appendices and supplemental material for the experimental study (stimuli, raw data, and analysis code) are available at osf.io/btszh.
Materials
PDF | Preprint | DOI | Homepage | Supplement | Preregistration | Code | Software (Archive) | Award | Reproducibility Report | Video Presentation | University News | BibTeX | SIGMOD 2021 Most Reproducible Paper Award!Authors

Jiahui Zhang


H. V. Jagadish

Citation
QueryVis: Logic-based diagrams help users understand complicated SQL queries faster
Aristotelis Leventidis, Jiahui Zhang, Cody Dunne, Wolfgang Gatterbauer, H. V. Jagadish, and Mirek Riedewald. Proc. ACM SIGMOD International Conference on Management of Data—SIGMOD. 2020. DOI: 10.1145/3318464.3389767
PDF | Preprint | DOI | Homepage | Supplement | Preregistration | Code | Software (Archive) | Award | Reproducibility Report | Video Presentation | University News | BibTeX | SIGMOD 2021 Most Reproducible Paper Award!
Khoury Vis Lab — Northeastern University
* West Village H, Room 302, 440 Huntington Ave, Boston, MA 02115, USA
* 100 Fore Street, Portland, ME 04101, USA
* Carnegie Hall, 201, 5000 MacArthur Blvd, Oakland, CA 94613, USA