Effective use of Likert scales in visualization evaluations: a systematic review
Abstract
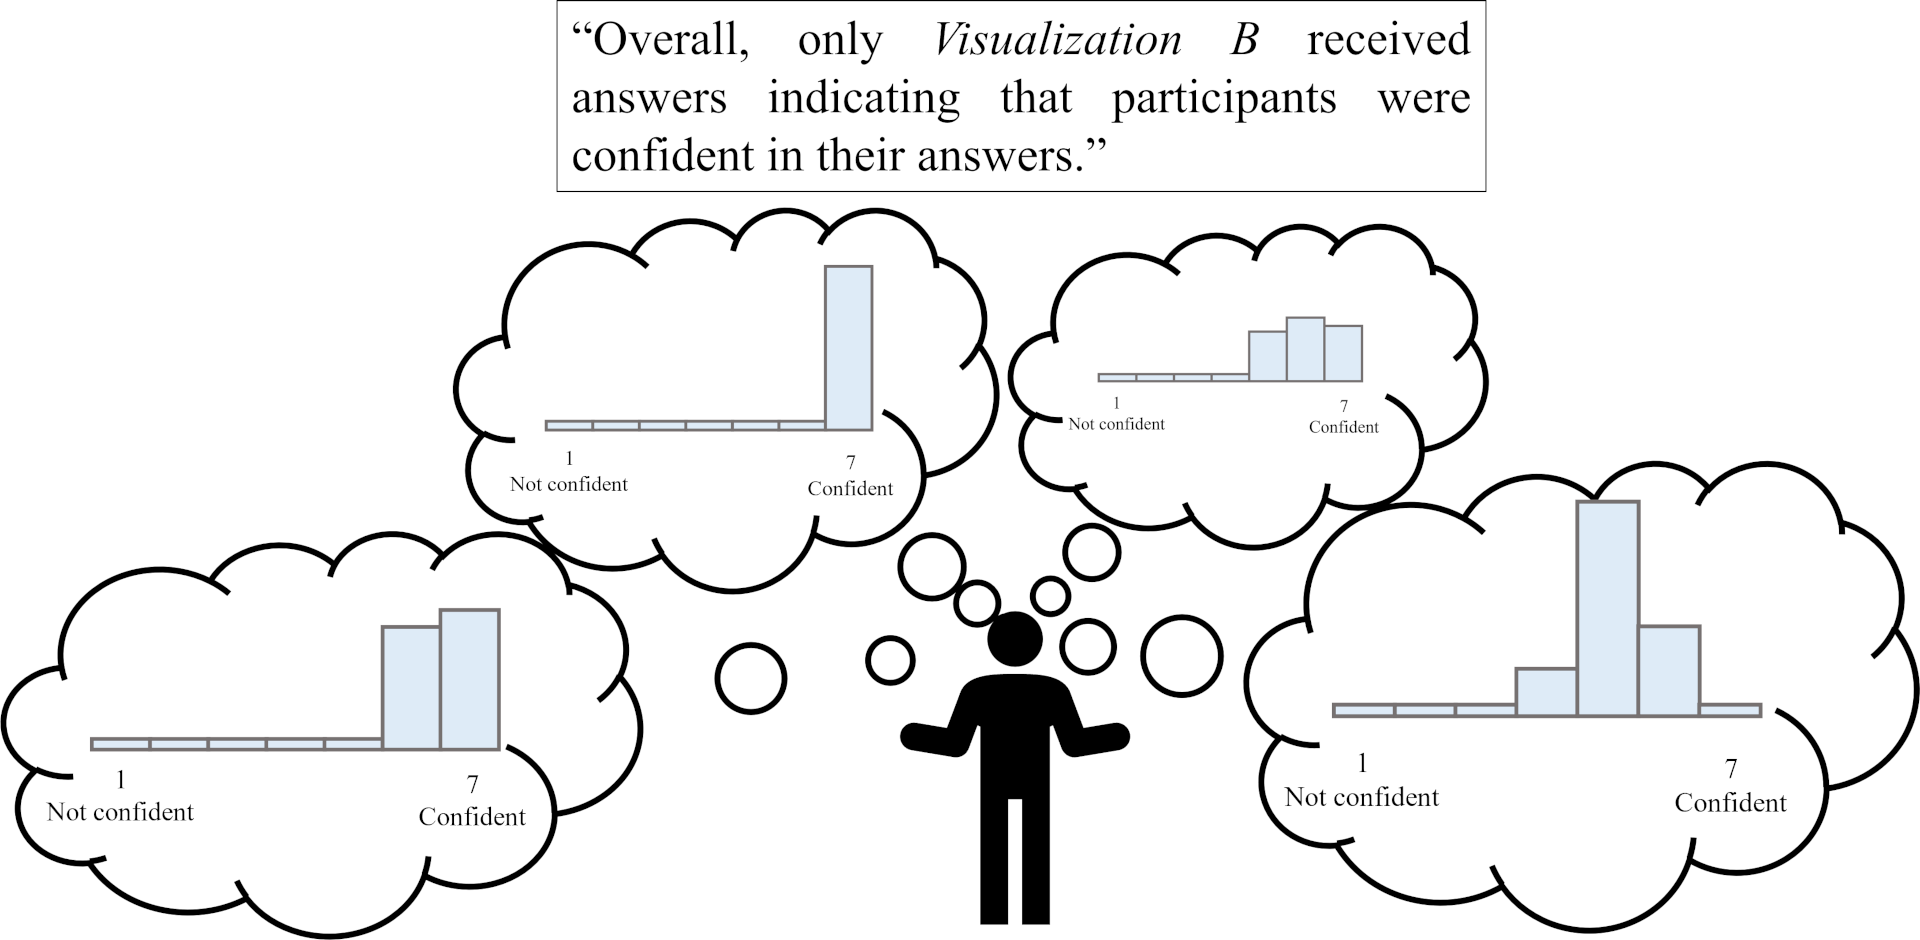
Likert scales are often used in visualization evaluations to produce quantitative estimates of subjective attributes, such as ease of use or aesthetic appeal. However, the methods used to collect, analyze, and visualize data collected with Likert scales are inconsistent among evaluations in visualization papers. In this paper, we examine the use of Likert scales as a tool for measuring subjective response in a systematic review of 134 visualization evaluations published between 2009 and 2019. We find that papers with both objective and subjective measures do not hold the same reporting and analysis standards for both aspects of their evaluation, producing less rigorous work for the subjective qualities measured by Likert scales. Additionally, we demonstrate that many papers are inconsistent in their interpretations of Likert data as discrete or continuous and may even sacrifice statistical power by applying nonparametric tests unnecessarily. Finally, we identify instances where key details about Likert item construction with the potential to bias participant responses are omitted from evaluation methodology reporting, inhibiting the feasibility and reliability of future replication studies. We summarize recommendations from other fields for best practices with Likert data in visualization evaluations, based on the results of our survey. A full copy of this paper and all supplementary material are available at https://osf.io/exbz8/.
Authors


Citation
Effective use of Likert scales in visualization evaluations: a systematic review
Laura South, David Saffo, Olga Vitek, Cody Dunne, and Michelle A. Borkin. Computer Graphics Forum—EuroVis/CGF. 2022. DOI: 10.1111/cgf.14521
PDF | Preprint | DOI | Supplement | BibTeX
Khoury Vis Lab — Northeastern University
* West Village H, Room 302, 440 Huntington Ave, Boston, MA 02115, USA
* 100 Fore Street, Portland, ME 04101, USA
* Carnegie Hall, 201, 5000 MacArthur Blvd, Oakland, CA 94613, USA