Beyond Initial Creation: Two Decades of Community-based Chart Revisions from Wikimedia Commons
Abstract
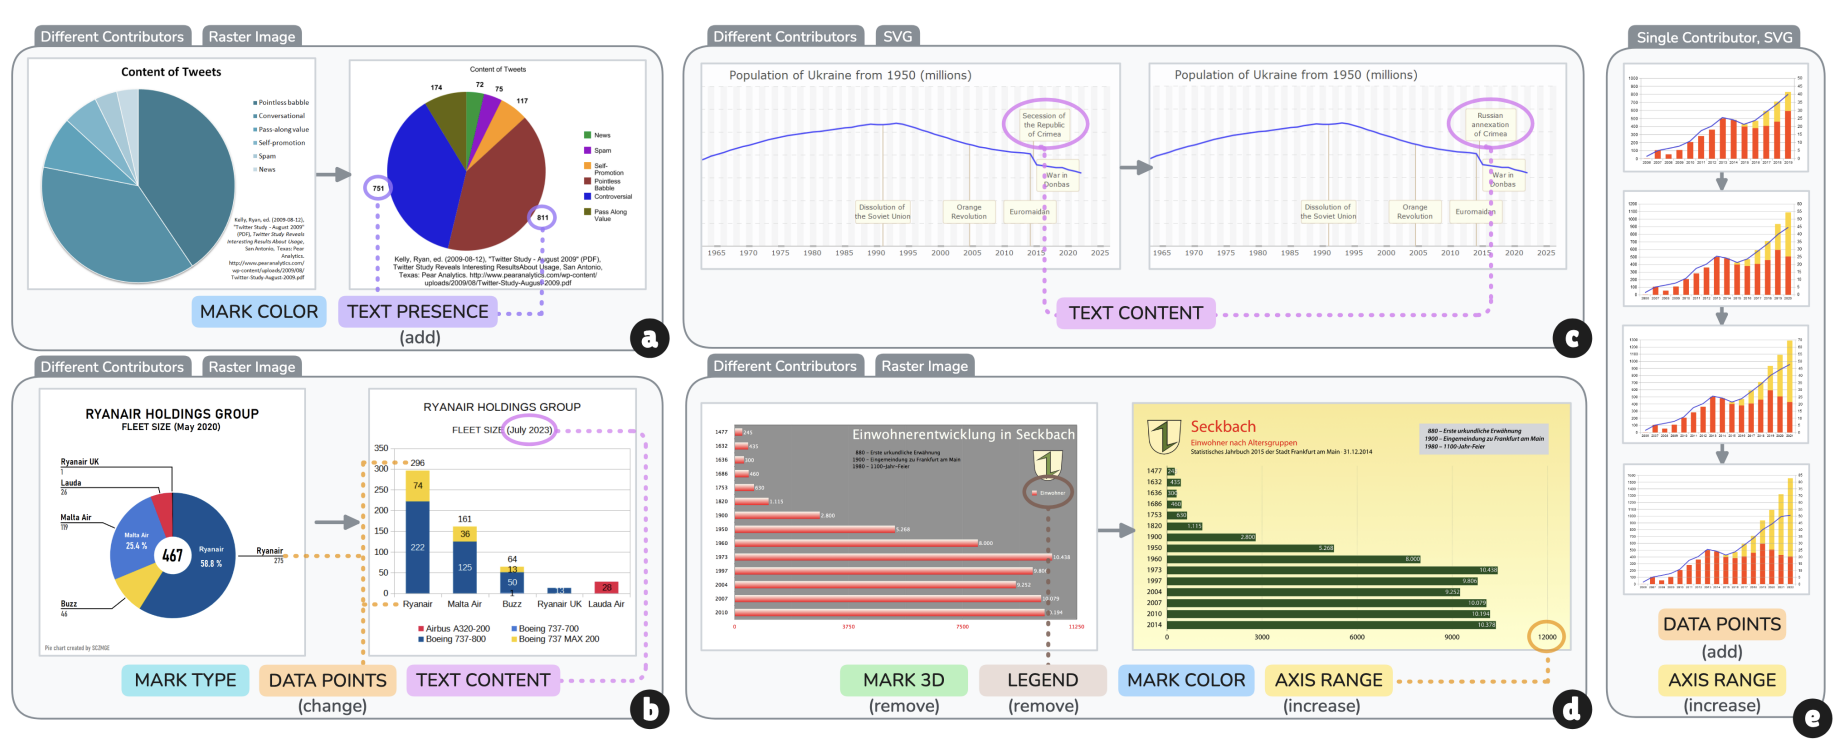
Open online communities like Wikipedia offer a rich space for understanding the organic evolution of public-facing artifacts, but little is known about how these communities collectively edit chart images. We investigate the phenomenon of "community editing" of visualizations by exploring chart revision patterns on Wikimedia Commons. We introduce a novel dataset of 7,786 longitudinal chart revisions across 1,664 images, labeled with edit categories using an LLM pipeline. Initial data analysis uncovered several novel findings. Multi-contributor revision is associated with more edits to mark styling and text content compared to single-contributor revision. Temporally, mark and text edits occur in more "bursty" cadences than data edits. In addition, while SVG charts attract more unique contributors and revisions than raster charts, their edit histories involve more tightly scoped and less diverse changes. This dataset enables a wide range of analyses of chart change over time.
Authors

Citation
Beyond Initial Creation: Two Decades of Community-based Chart Revisions from Wikimedia Commons
Jasmine Y. Shih, Chase Stokes, Melanie Tory, and Marti Hearst. Proc. IEEE Visualization Conference—VIS. 2026.
Khoury Vis Lab — Northeastern University
* West Village H, Room 302, 440 Huntington Ave, Boston, MA 02115, USA
* 100 Fore Street, Portland, ME 04101, USA
* Carnegie Hall, 201, 5000 MacArthur Blvd, Oakland, CA 94613, USA