Data Comets: Designing a visualization tool for analyzing autonomous aerial vehicle logs with grounded evaluation
Abstract
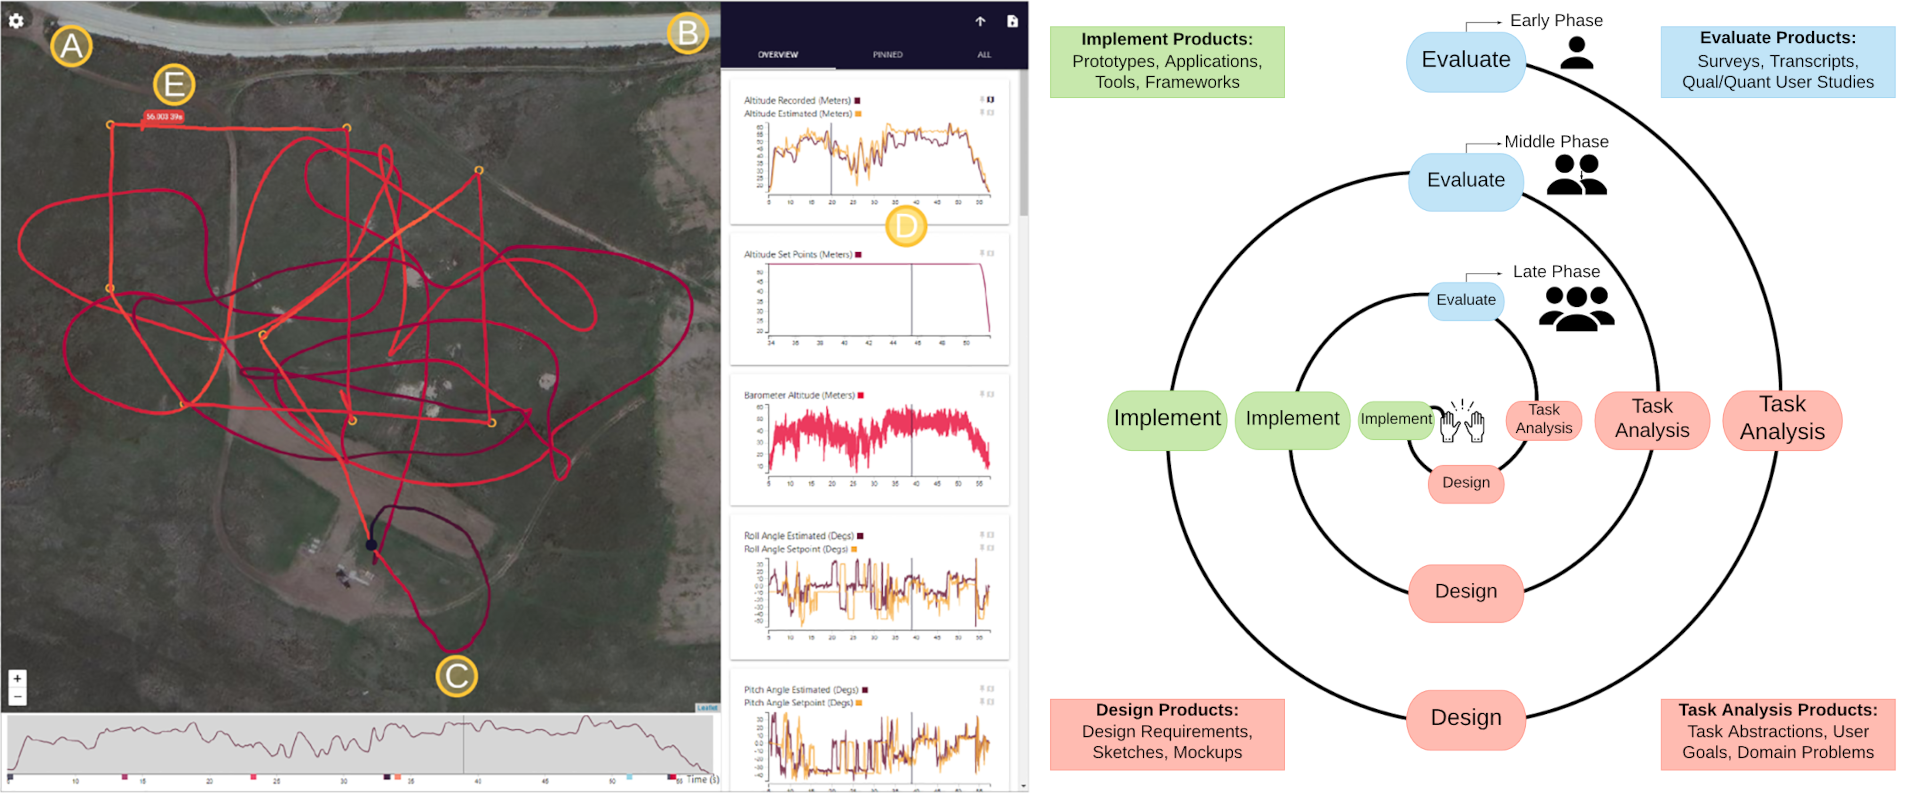
Autonomous unmanned aerial vehicles are complex systems of hardware, software, and human input. Understanding this complexity is key to their development and operation. Information visualizations already exist for exploring flight logs but comprehensive analyses currently require several disparate and custom tools. This design study helps address the pain points faced by autonomous unmanned aerial vehicle developers and operators. We contribute: a spiral development process model for grounded evaluation visualization development focused on progressively broadening target user involvement and refining user goals; a demonstration of the model as part of developing a deployed and adopted visualization system; a data and task abstraction for developers and operators performing post-flight analysis of autonomous unmanned aerial vehicle logs; the design and implementation of Data Comets, an open-source and web-based interactive visualization tool for post-flight log analysis incorporating temporal, geospatial, and multivariate data; and the results of a summative evaluation of the visualization system and our abstractions based on in-the-wild usage. A free copy of this paper and source code are available at https://osf.io/h4p7g
Materials
PDF | Preprint | DOI | Homepage | Supplement | Code | Demo Video | Video Presentation | BibTeXAuthors


Citation
Data Comets: Designing a visualization tool for analyzing autonomous aerial vehicle logs with grounded evaluation
David Saffo, Aristotelis Leventidis, Twinkle Jain, Michelle A. Borkin, and Cody Dunne. Computer Graphics Forum—EuroVis/CGF. 2020. DOI: 10.1111/cgf.13994
PDF | Preprint | DOI | Homepage | Supplement | Code | Demo Video | Video Presentation | BibTeX
Khoury Vis Lab — Northeastern University
* West Village H, Room 302, 440 Huntington Ave, Boston, MA 02115, USA
* 100 Fore Street, Portland, ME 04101, USA
* Carnegie Hall, 201, 5000 MacArthur Blvd, Oakland, CA 94613, USA