GeoSocialVis: Visualizing geosocial academic co-authorship networks by balancing topology- and geography-based layout
Abstract
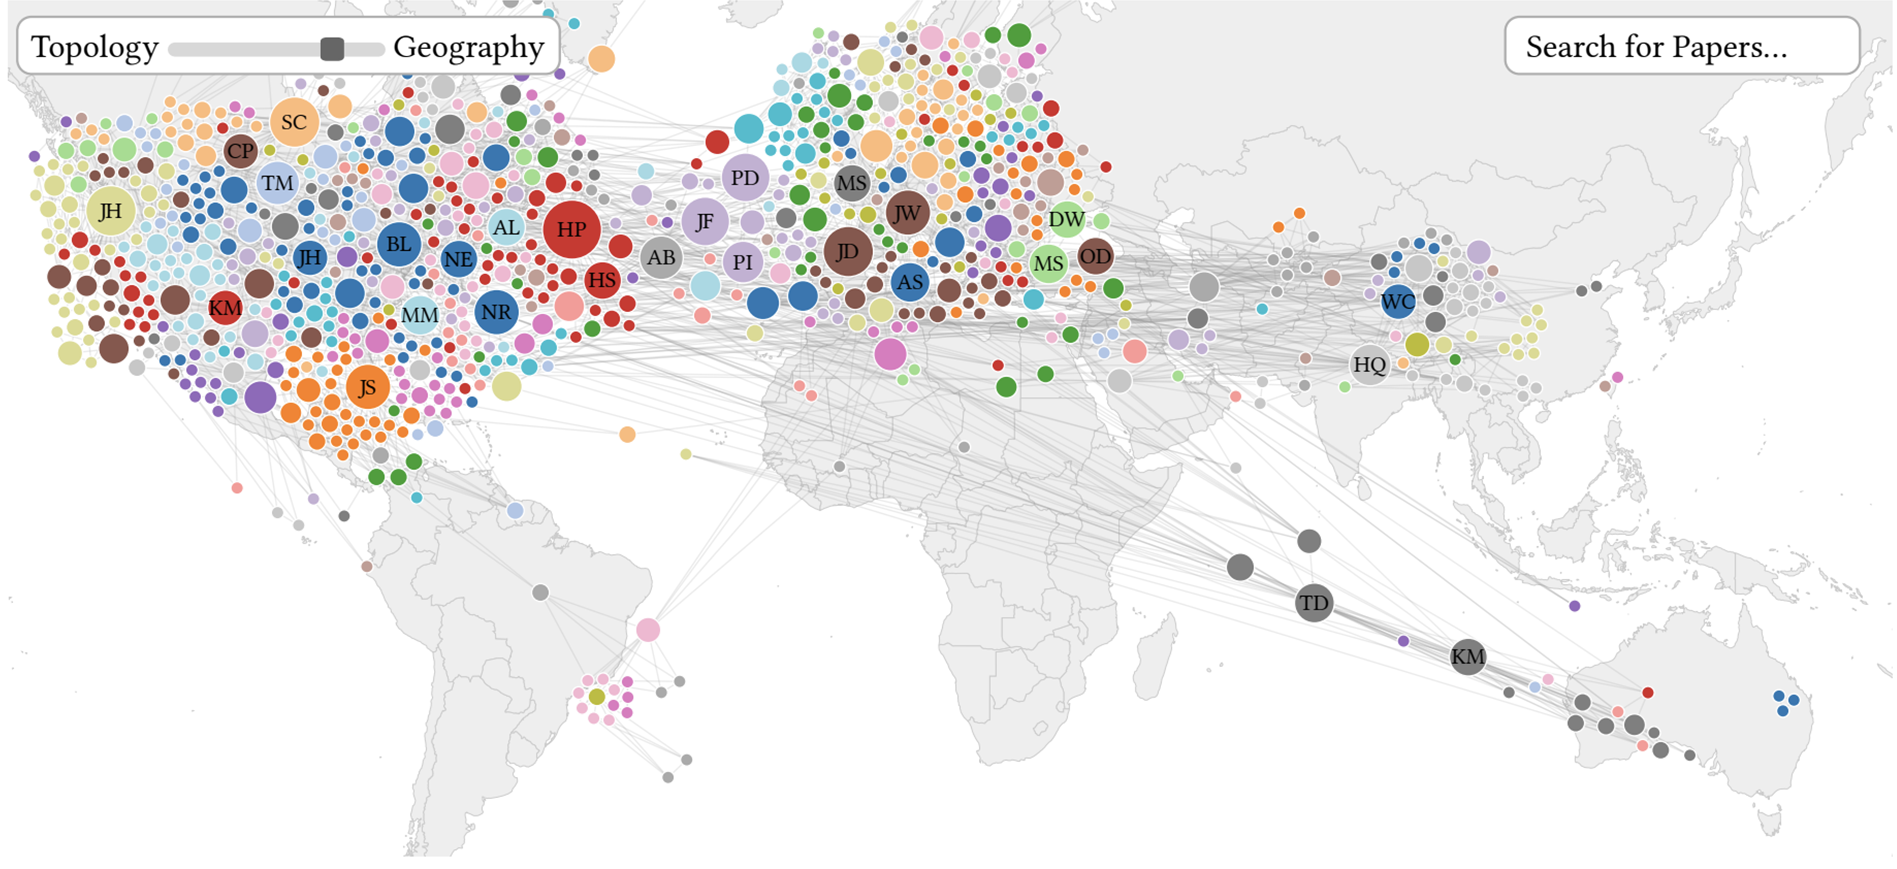
In many domains, it is important to understand both the topology and geography of a network. E.g., for researchers it is important to understand the topics in a field, where this research is taking place, and which researchers collaborate. Geography plays a key role in collaboration as it is more feasible with physical proximity. Researchers are also likely to continue existing collaborations. The interplay between topology and geography is of particular interest. Within-institution collaborations are different in nature from far-distance collaborations, as long-distance collaborations often occur less out of convenience but for more complementary expertise. These long-distance collaborations can connect otherwise separate social groups. However, existing approaches either focus on the geospatial location of researchers, or on the social aspect of collaborations alone. We present GeoSocialVis, an interactive visualization tool for scientometrics analyses with a focus on displaying the geosocial co-authorship network. GeoSocialVis uses a novel force layout that strikes a user-defined balance between showing network topology and the geographic locations of the authors. Users can explore relevant publications, researchers, groups, and institutions by adjusting the balance between topology and geography, searching by keywords, and with details-on-demand. We demonstrate the utility of GeoSocialVis with a case study with IEEE Information Visualization 2008–2018 publication data. Source code and an interactive demo are available online at dsaffo.github.io/GeoSocialVis.


Citation
GeoSocialVis: Visualizing geosocial academic co-authorship networks by balancing topology- and geography-based layout
David Saffo, Michail Schwab, Michelle A. Borkin, and Cody Dunne. Poster at InfoVis: IEEE Information Visualization—VIS Posters. 2019. DOI: 10.31219/osf.io/ykwah
Khoury Vis Lab — Northeastern University
* West Village H, Room 302, 440 Huntington Ave, Boston, MA 02115, USA
* 100 Fore Street, Portland, ME 04101, USA
* Carnegie Hall, 201, 5000 MacArthur Blvd, Oakland, CA 94613, USA