Struggles and strategies in understanding information visualizations
Abstract
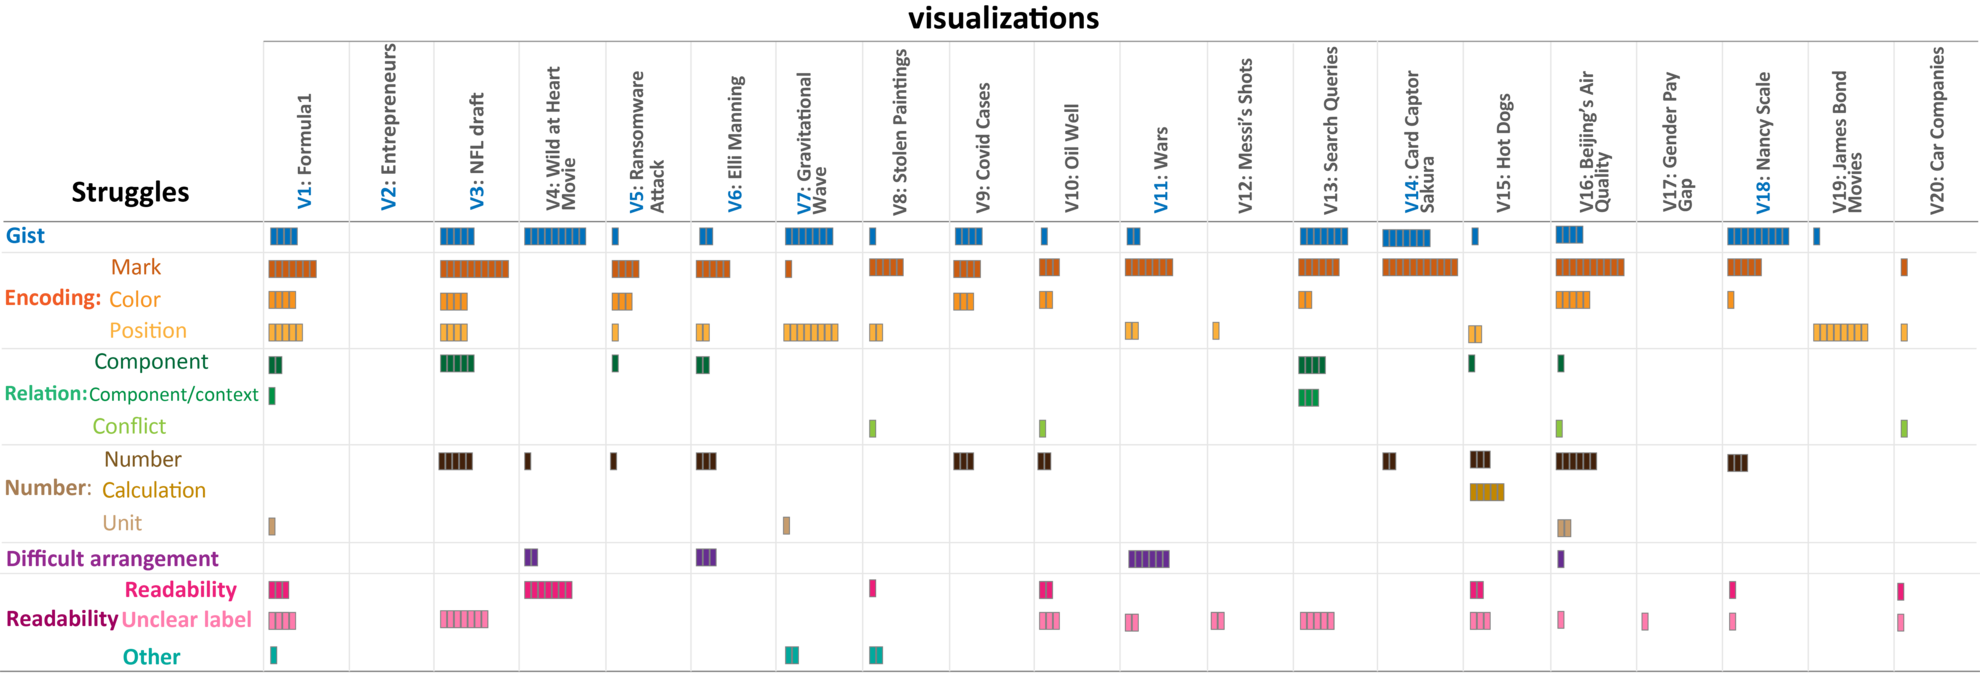
While the visualization community is increasingly aware that people often find visualizations difficult to understand, there is less information about what we need to do to create comprehensible visualizations. To help visualization creators and designers improve their visualizations, we need to better understand what kind of support people are looking for in their sensemaking process. Empirical studies are needed to tease apart the details of what makes the process of understanding difficult for visualization viewers. We conducted a qualitative study with 14 participants, observing them as they described how they were trying to make sense of 20 information visualizations. We identified the challenges participants faced throughout their sensemaking process and the strategies they employed to help themselves in overcoming the challenges. Our findings show how details and nuances within visualizations can impact comprehensibility and offer research suggestions to help us move toward more understandable visualizations.
Authors

Citation
Struggles and strategies in understanding information visualizations
Maryam Rezaie, Melanie Tory, and Sheelagh Carpendale. IEEE Transactions on Visualization and Computer Graphics—PacificVis/TVCG. 2024. DOI: 10.1109/TVCG.2024.3388560
Khoury Vis Lab — Northeastern University
* West Village H, Room 302, 440 Huntington Ave, Boston, MA 02115, USA
* 100 Fore Street, Portland, ME 04101, USA
* Carnegie Hall, 201, 5000 MacArthur Blvd, Oakland, CA 94613, USA