A Visual Analytics Framework Case Study: Understanding Colombia’s National Administrative Department of Statistics Datasets
Abstract
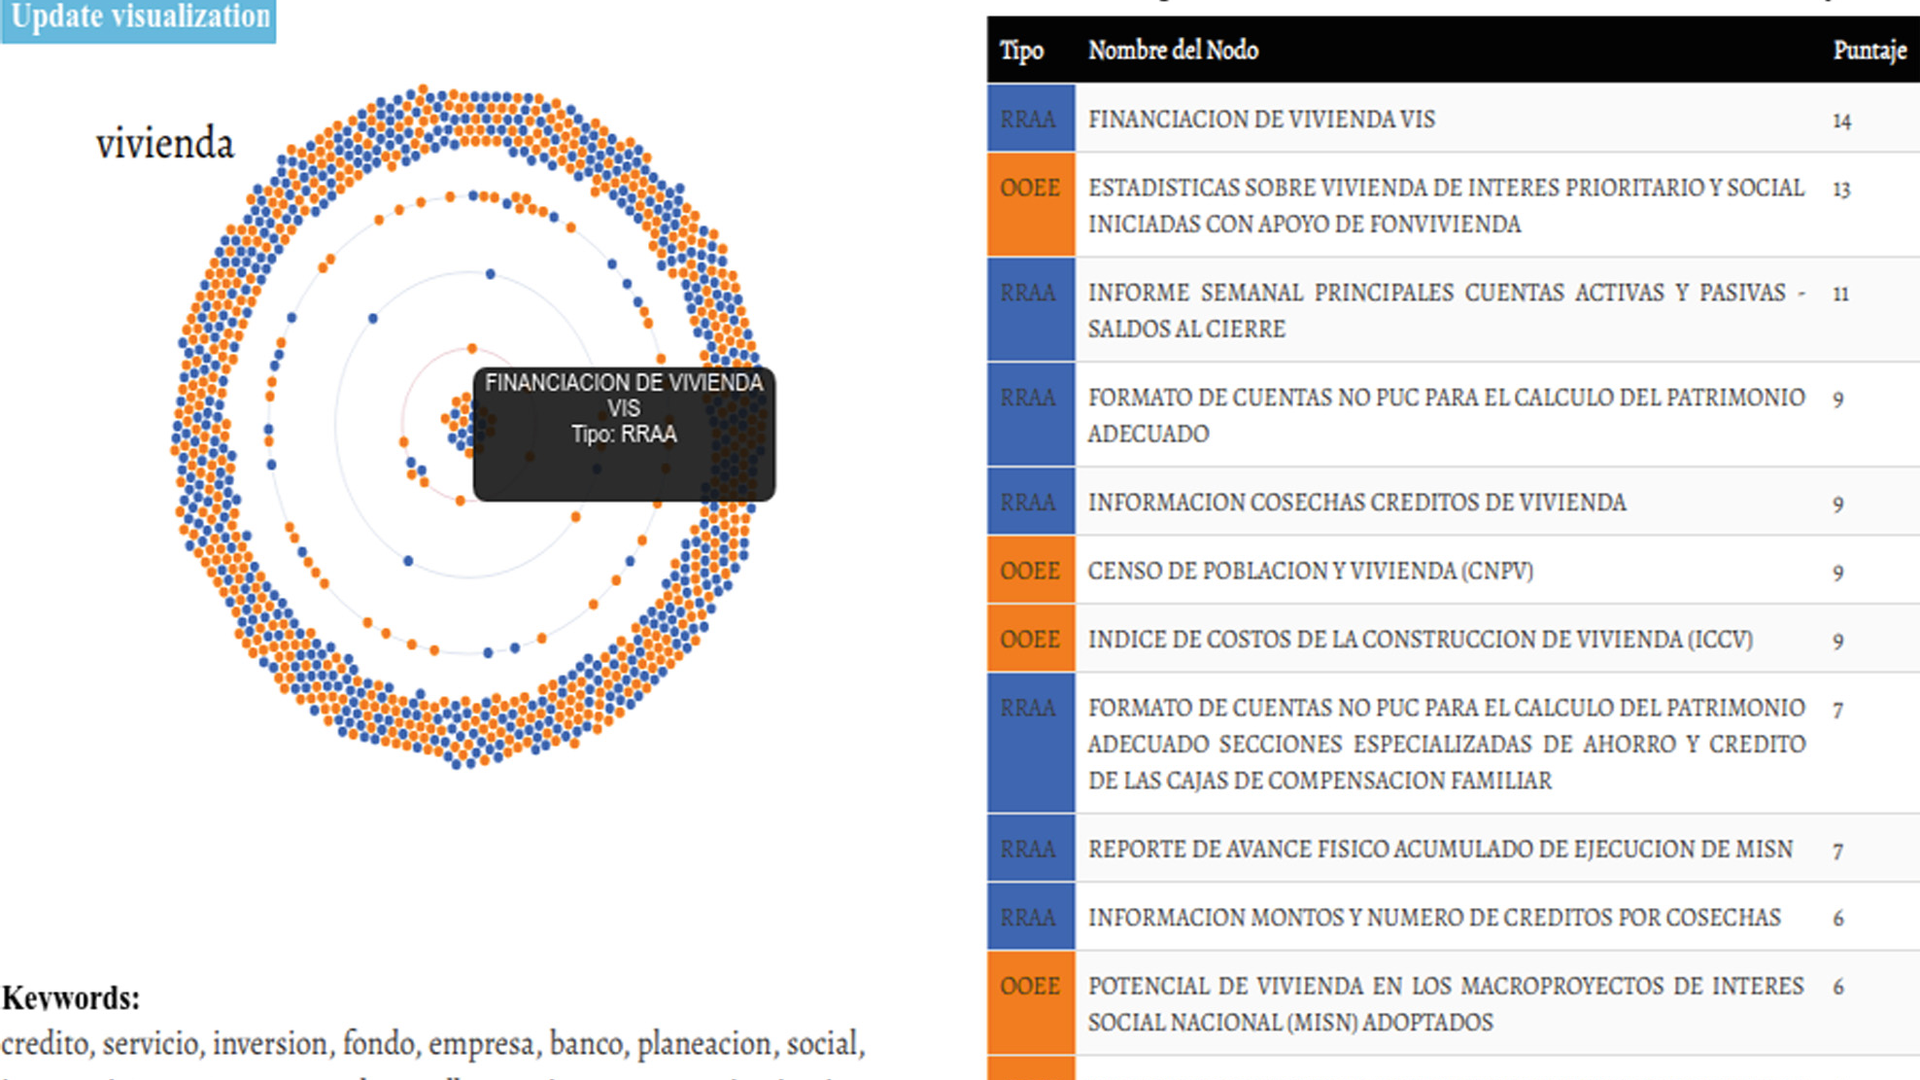
This paper presents a visual analytics framework applied as a case study to understand the classification system of Colombia's National Administrative Department of Statistics (DANE). The work demonstrates the use of information visualization techniques to extract and communicate complex statistical structures to domain experts and the general public.
Authors

Citation
A Visual Analytics Framework Case Study: Understanding Colombia’s National Administrative Department of Statistics Datasets
Pierre Raimbaud, Jaime Camilo Espitia Castillo, and John Alexis Guerra-Gomez. Communications in Computer and Information Science—CCIS. 2019. DOI: 10.1007/978-3-030-37386-3_5
Khoury Vis Lab — Northeastern University
* West Village H, Room 302, 440 Huntington Ave, Boston, MA 02115, USA
* 100 Fore Street, Portland, ME 04101, USA
* Carnegie Hall, 201, 5000 MacArthur Blvd, Oakland, CA 94613, USA