The HEART Interface: Visualizing Risk Score Uncertainty in the Cardiothoracic ICU
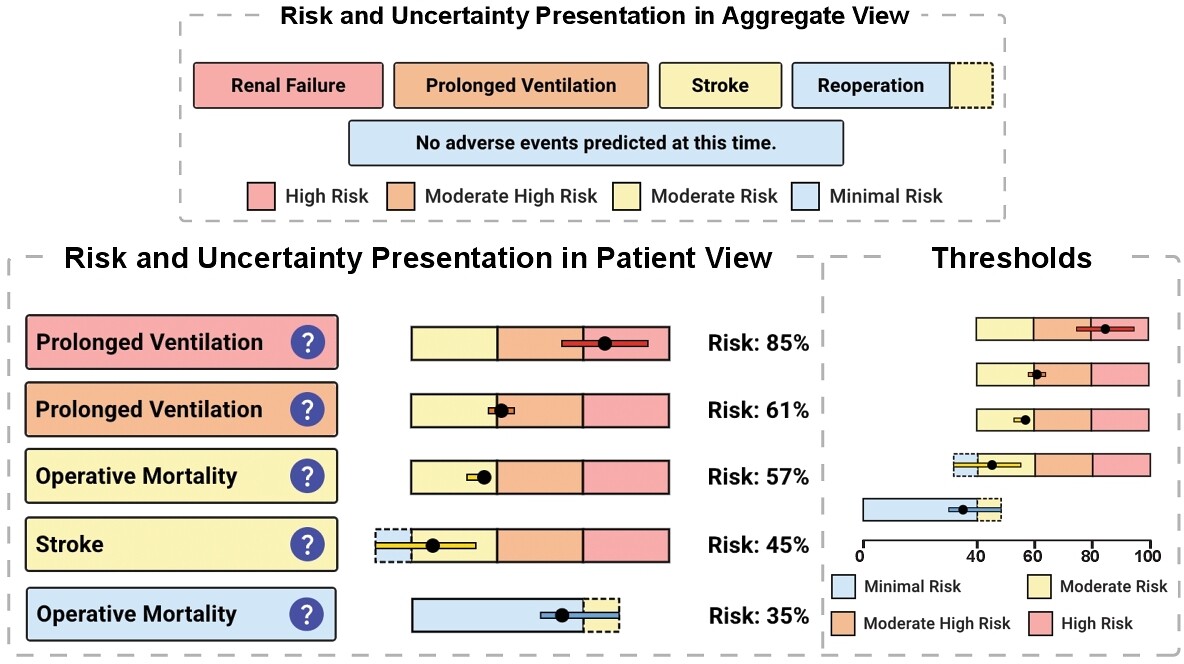
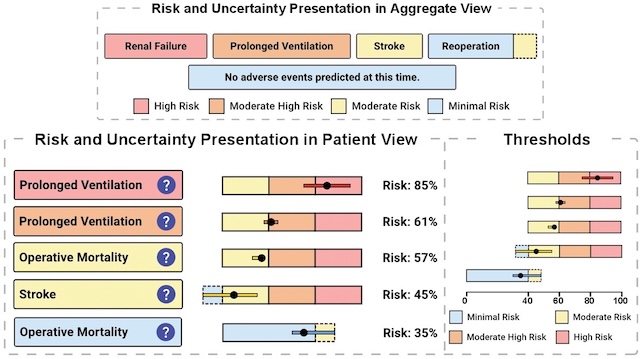
A figure titled "Risk and Uncertainty Presentation in Aggregate View" and "Risk and Uncertainty Presentation in Patient View" shows a medical decision-support interface for surgical risk communication.
Top section (Aggregate View): Four color-coded risk badges label predicted adverse events for a patient: Renal Failure (high risk, red), Prolonged Ventilation (moderate-high risk, orange), Stroke (moderate risk, yellow), and Reoperation (minimal risk, light blue). A blue banner reads "No adverse events predicted at this time." A legend defines the four risk levels by color.
Bottom-left section (Patient View): A vertical list of five adverse events — Prolonged Ventilation, Prolonged Ventilation, Operative Mortality, Stroke, and Operative Mortality — each paired with a horizontal bar chart showing the predicted risk percentage and uncertainty range. Each bar is color-coded by risk level. A dot marks the point estimate, and a horizontal line through the dot represents the confidence interval. Risk percentages are: 85%, 61%, 57%, 45%, and 35%, respectively. Some bars are outlined with a dashed border, indicating uncertainty spans multiple risk categories. Each label includes a blue question-mark icon suggesting additional information is available.
Bottom-right section (Thresholds): A corresponding set of horizontal bar charts on a 0–100 scale illustrates where each patient's risk estimate falls relative to clinical thresholds dividing minimal, moderate, moderate-high, and high risk zones.
Top: Five distinct examples of adverse event presentations based on risk level in the Aggregate View. Note that minimal risk is not typically displayed, except in two cases: (1) when no high or moderate risks are predicted for any adverse events, a label is shown to indicate this (e.g., the label in the middle); and (2) when minimal risk falls within a borderline range, suggesting it might be moderate risk due to uncertainty (e.g., the Reoperation label in this image). Bottom Left: Five examples of adverse event visualizations from the Individual Patient View, including borderline cases where moderate-risk events may appear as minimal risk due to uncertainty. Bottom Right: Adverse risk category thresholds are displayed on a 0–100% scale for improved clarity.
Abstract
Artificial Intelligence (AI) holds significant potential for supporting clinical decision-making, particularly in high-pressure environments, such as Cardiothoracic Intensive Care Units (CT-ICU). Care teams in these settings face challenges such as alarm fatigue, rapid staff turnover, time-sensitive decisions, and an overwhelming amount of data. AI-driven Clinical Decision-Support Systems (AI-CDSS) can support care teams in overcoming some of these challenges by providing solutions like detecting and reporting risk scores for adverse events that may lead to increased fatalities or re-admissions, enabling timely intervention. One key challenge with risk scores is missing data, which can create considerable uncertainty in risk score values. AI-CDSSs rarely convey the risk score uncertainty, which is important in the effectiveness and reliability of clinical decision-making. In this paper, we describe the interface design process for HEART, an AI-powered system developed collaboratively with clinical and AI experts over a 16-month iterative design process for a hospital’s CT-ICU. The HEART interactive interface integrates understandable visualizations of risk scores and their uncertainty within both a holistic view of all patients in the unit and detailed patient-specific views. We reflect on the user-centered design process, report findings from an expert walkthrough study, and discuss lessons learned as well as broader implications. This work contributes valuable insights into uncertainty visualization design for AI-derived risk scores in a critical care application. Beyond these specific insights, our work illustrates the kind of comprehensive, human-centered design process necessary for responsible AI adoption in critical environments.
Materials
DOI | Supplement | BibTeX
Authors
Citation
Thumbnail image for publication titled: The HEART Interface: Visualizing Risk Score Uncertainty in the Cardiothoracic ICU
The HEART Interface: Visualizing Risk Score Uncertainty in the Cardiothoracic ICU

Mahsan Nourani, Lien Nguyen, Carey Barry, Qingchu Jin, and Melanie Tory. IUI '26: Proceedings of the 31st International Conference on Intelligent User Interfaces. 2026. DOI: https://doi.org/10.1145/3742413.3789109

DOI | Supplement | BibTeX


Khoury Vis Lab — Northeastern University
* West Village H, Room 302, 440 Huntington Ave, Boston, MA 02115, USA
* 100 Fore Street, Portland, ME 04101, USA
* Carnegie Hall, 201, 5000 MacArthur Blvd, Oakland, CA 94613, USA