Average estimates in line graphs are biased toward areas of higher variability
Abstract
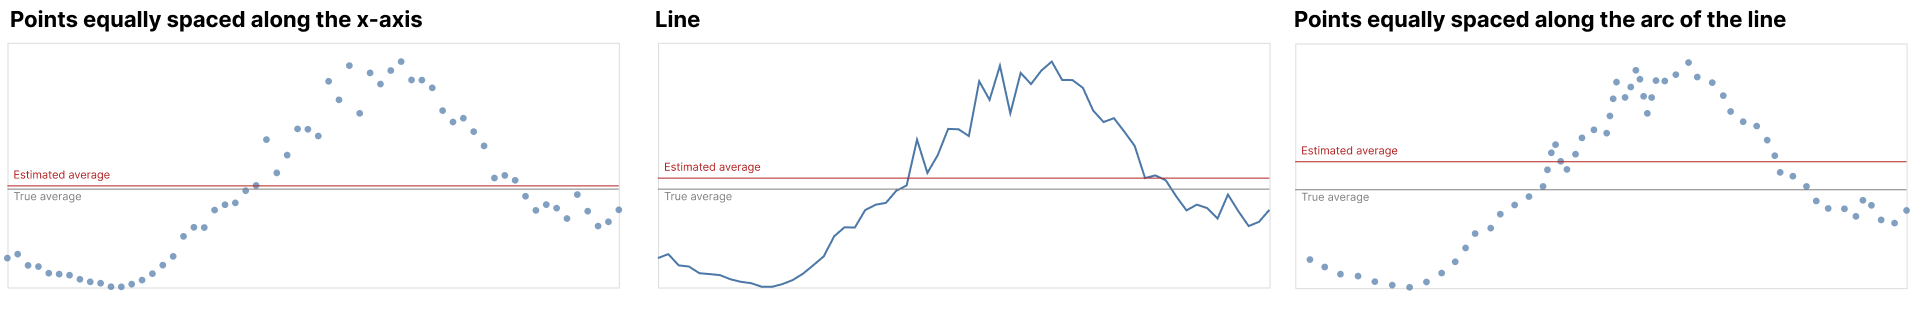
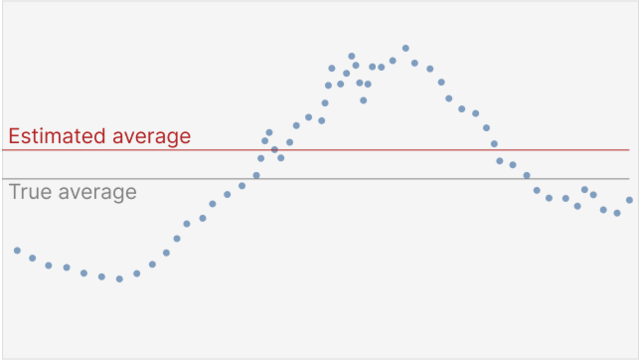
We investigate variability overweighting, a previously undocumented bias in line graphs, where estimates of average value are biased toward areas of higher variability in that line. We found this effect across two preregistered experiments with 140 and 420 participants. These experiments also show that the bias is reduced when using a dot encoding of the same series. We can model the bias with the average of the data series and the average of the points drawn along the line. This bias might arise because higher variability leads to stronger weighting in the average calculation, either due to the longer line segments (even though those segments contain the same number of data values) or line segments with higher variability being otherwise more visually salient. Understanding and predicting this bias is important for visualization design guidelines, recommendation systems, and tool builders, as the bias can adversely affect estimates of averages and trends.
Materials
PDF | Preprint | Supplement | Preregistration | Code | Video preview | Award | BibTeX | VIS 2023 Best Paper Honorable Mention!Authors

Citation
Average estimates in line graphs are biased toward areas of higher variability
Dominik Moritz, Lace M. Padilla, Francis Nguyen, and Steven L. Franconeri. IEEE Transactions on Visualization and Computer Graphics—VIS/TVCG. 2023.
PDF | Preprint | Supplement | Preregistration | Code | Video preview | Award | BibTeX | VIS 2023 Best Paper Honorable Mention!
Khoury Vis Lab — Northeastern University
* West Village H, Room 302, 440 Huntington Ave, Boston, MA 02115, USA
* 100 Fore Street, Portland, ME 04101, USA
* Carnegie Hall, 201, 5000 MacArthur Blvd, Oakland, CA 94613, USA