SliceLens: guided exploration of machine learning datasets
Abstract
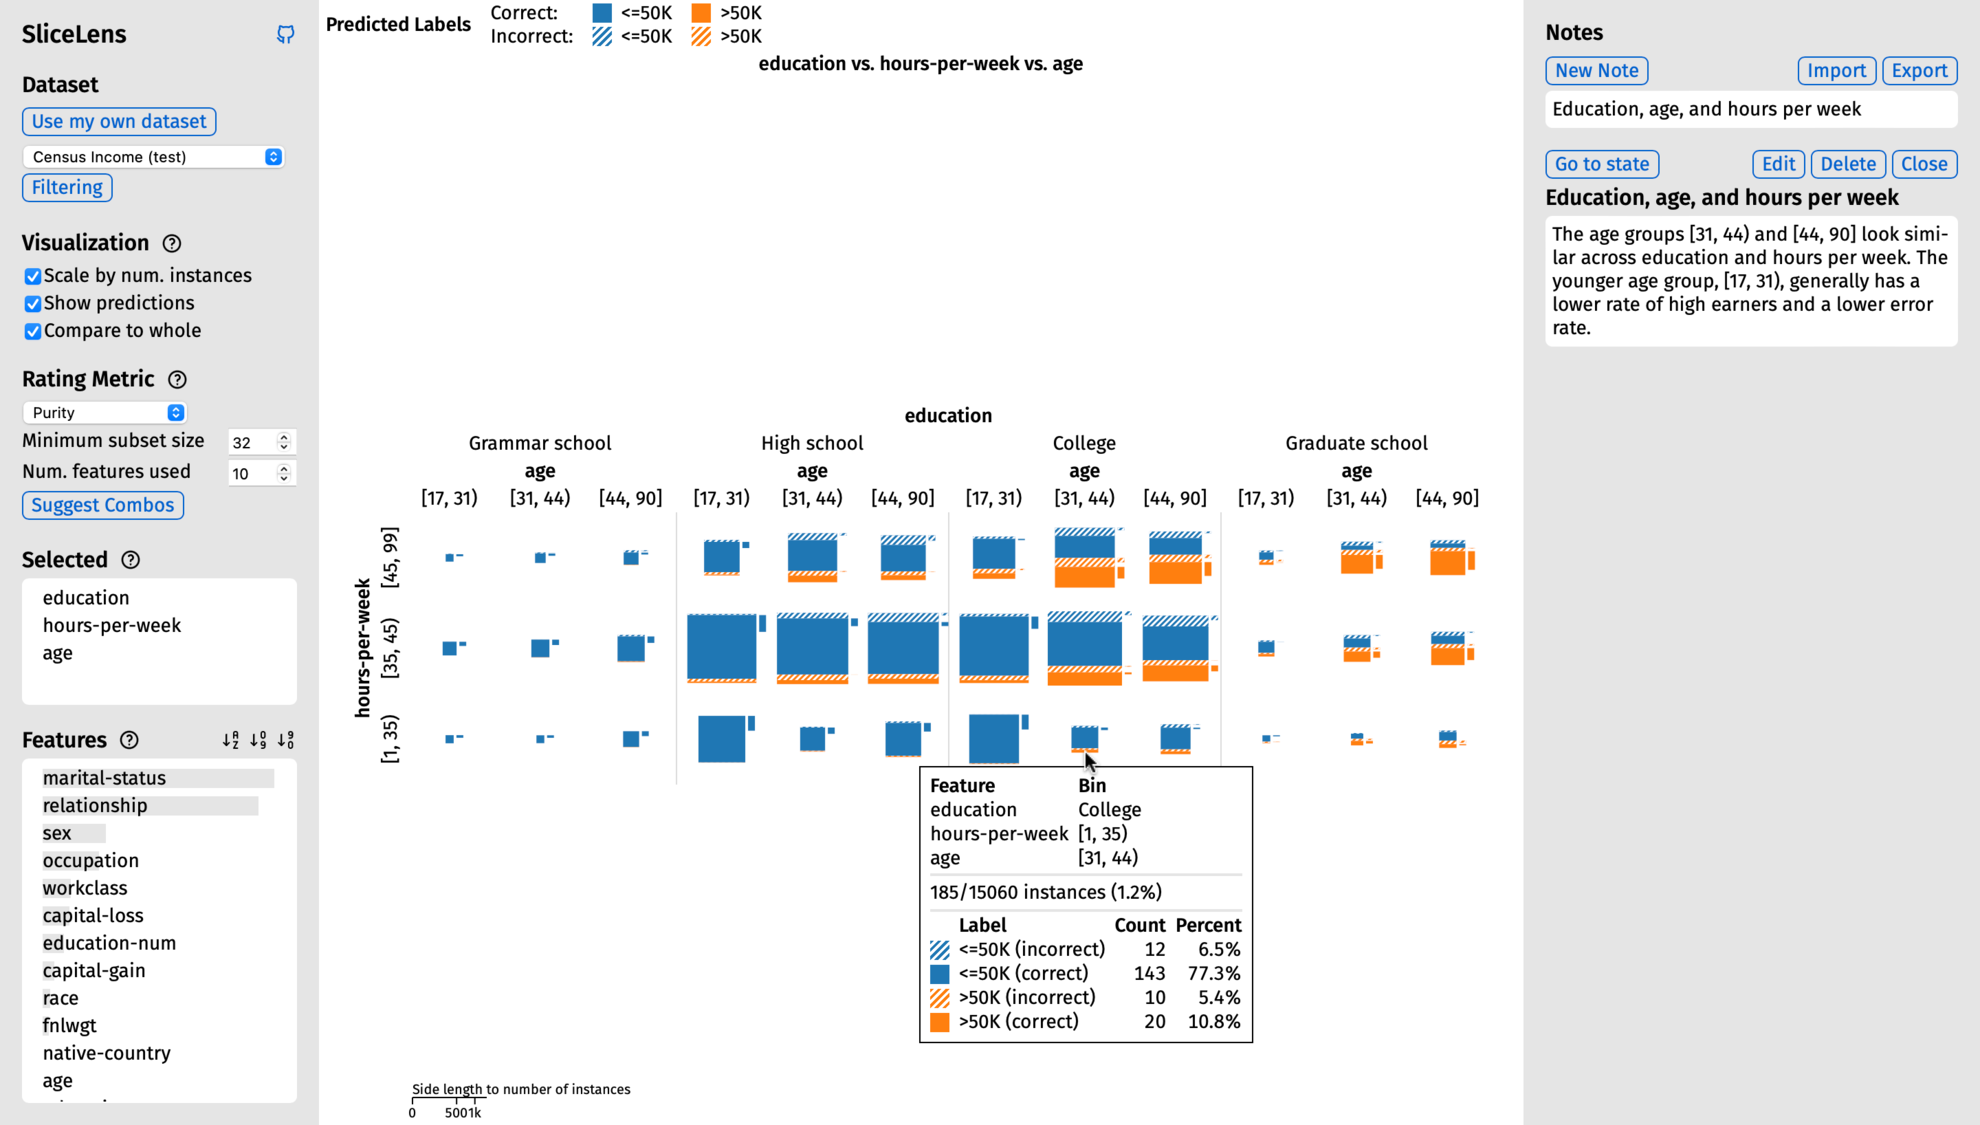
SliceLens is a tool for exploring labeled, tabular, machine learning datasets. To explore a dataset, the user selects combinations of features in the dataset that they are interested in. The tool splits those features into bins and then visualizes the label distributions for the subsets of data created by the intersections of the bins. SliceLens guides the user in determining which feature combinations to explore. Guidance is based on a user-selected rating metric, which assigns a score to the subsets created by a given combination of features. The purpose of the metrics are to detect interesting patterns in the subsets, such as subsets that have high label purity or an uneven distribution of errors. SliceLens uses the metrics to guide the user towards combinations of features that create potentially interesting subsets in two ways. First, SliceLens assigns a rating to each feature based on the subsets that would be created by selecting that feature. This incremental guidance can help the user determine which feature to select next. Second, SliceLens can suggest combinations of features ranked according to the chosen metric, which the user can then cycle through.


Citation
SliceLens: guided exploration of machine learning datasets
Daniel Kerrigan and Enrico Bertini. Proceedings of the Workshop on Human-In-the-Loop Data Analytics. 2023. DOI: 10.1145/3597465.3605217
Khoury Vis Lab — Northeastern University
* West Village H, Room 302, 440 Huntington Ave, Boston, MA 02115, USA
* 100 Fore Street, Portland, ME 04101, USA
* Carnegie Hall, 201, 5000 MacArthur Blvd, Oakland, CA 94613, USA