Towards Reusable and Reactive Widgets for Information Visualization Research and Dissemination
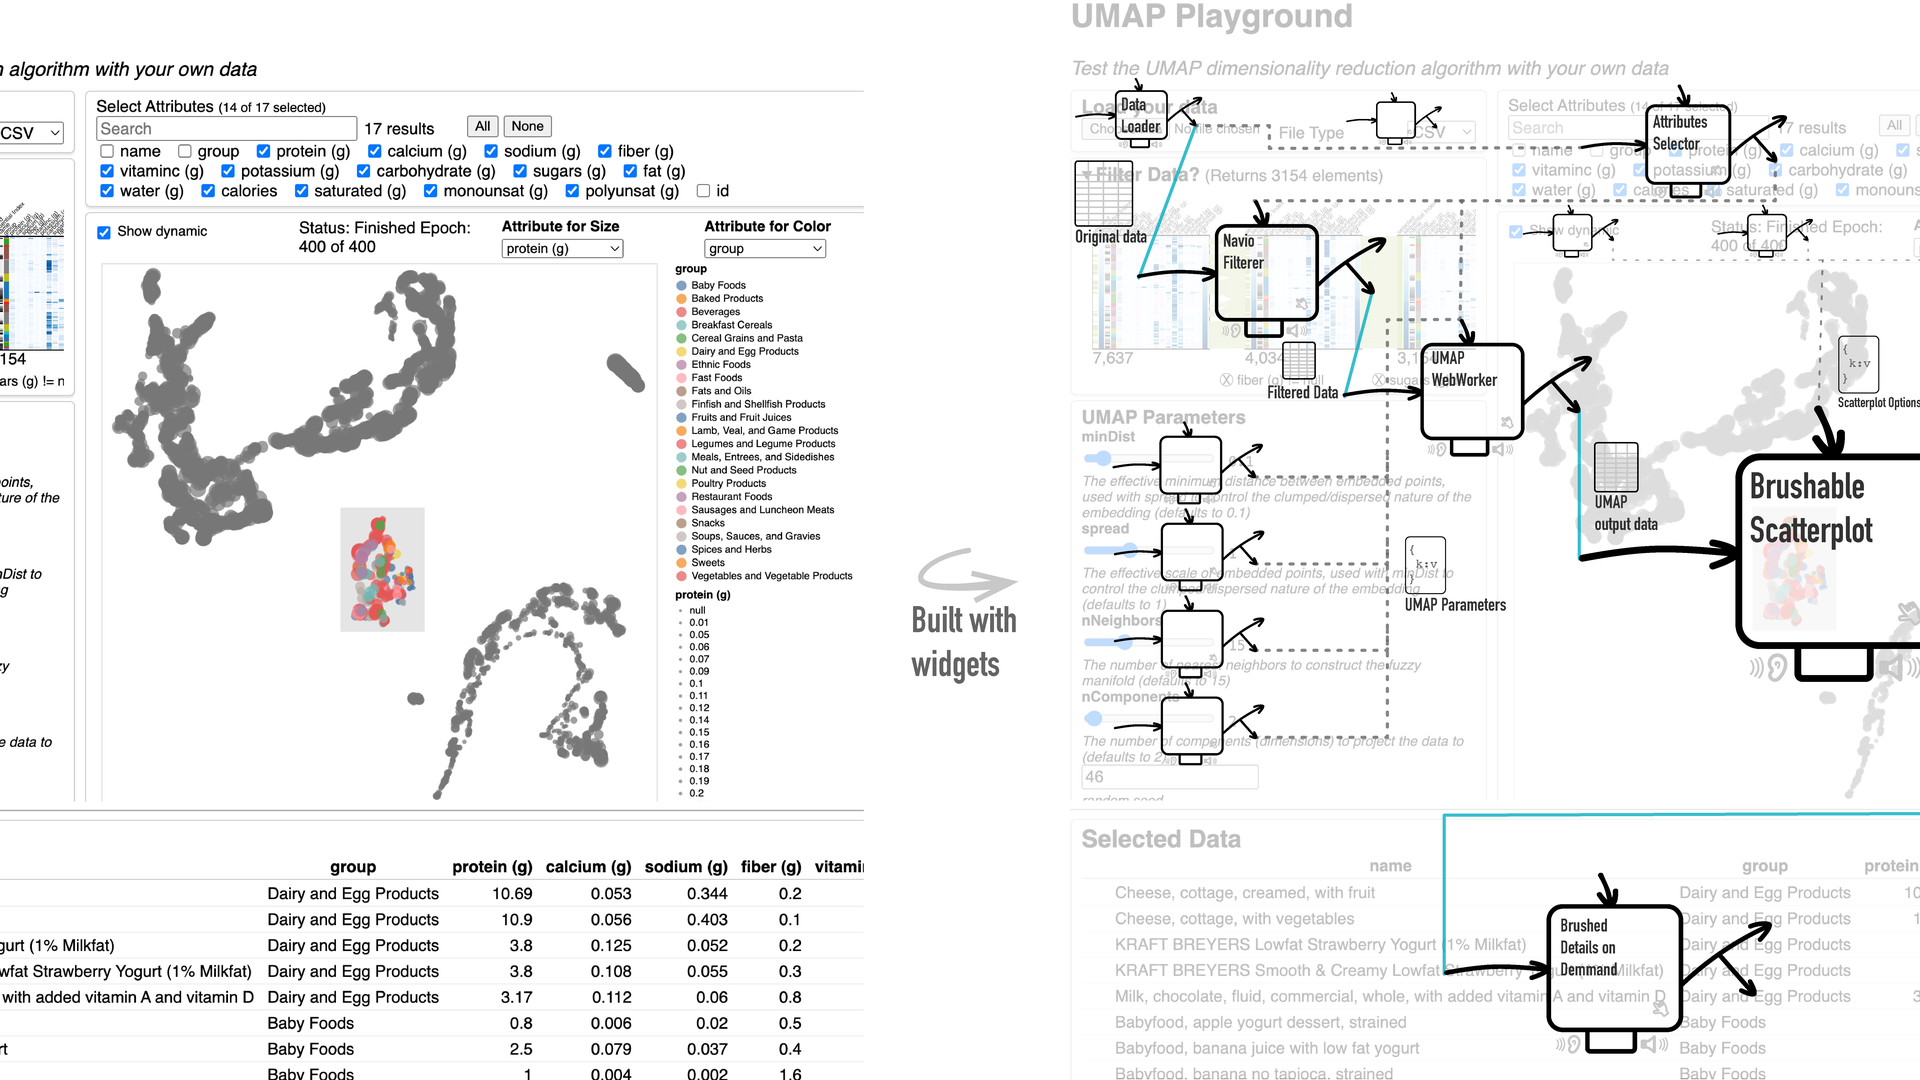
Two side-by-side panels. The left shows the UMAP Playground interactive visualization with a dark scatter plot of food product clusters, parameter sliders, and a data table. The right shows the reactive widget architecture diagram with labeled boxes for data input, UMAP processing, and a Brushable Scatterplot widget, connected by directed arrows.
Figure 1: Example information visualization application built using reusable and reactive widgets. The left panel shows the UMAP Playground interface; the right panel illustrates the reactive widget architecture connecting input data, brushable scatterplot, and selected data outputs.
Abstract
This paper advocates for reusable and reactive widgets as a paradigm for information visualization research and dissemination. We argue that encapsulating visualizations as self-contained, reactive components enables more reproducible research, easier deployment, and wider accessibility of visualization tools.
Materials
DOI | Homepage | BibTeX
Authors
Citation

Khoury Vis Lab — Northeastern University
* West Village H, Room 302, 440 Huntington Ave, Boston, MA 02115, USA
* 100 Fore Street, Portland, ME 04101, USA
* Carnegie Hall, 201, 5000 MacArthur Blvd, Oakland, CA 94613, USA