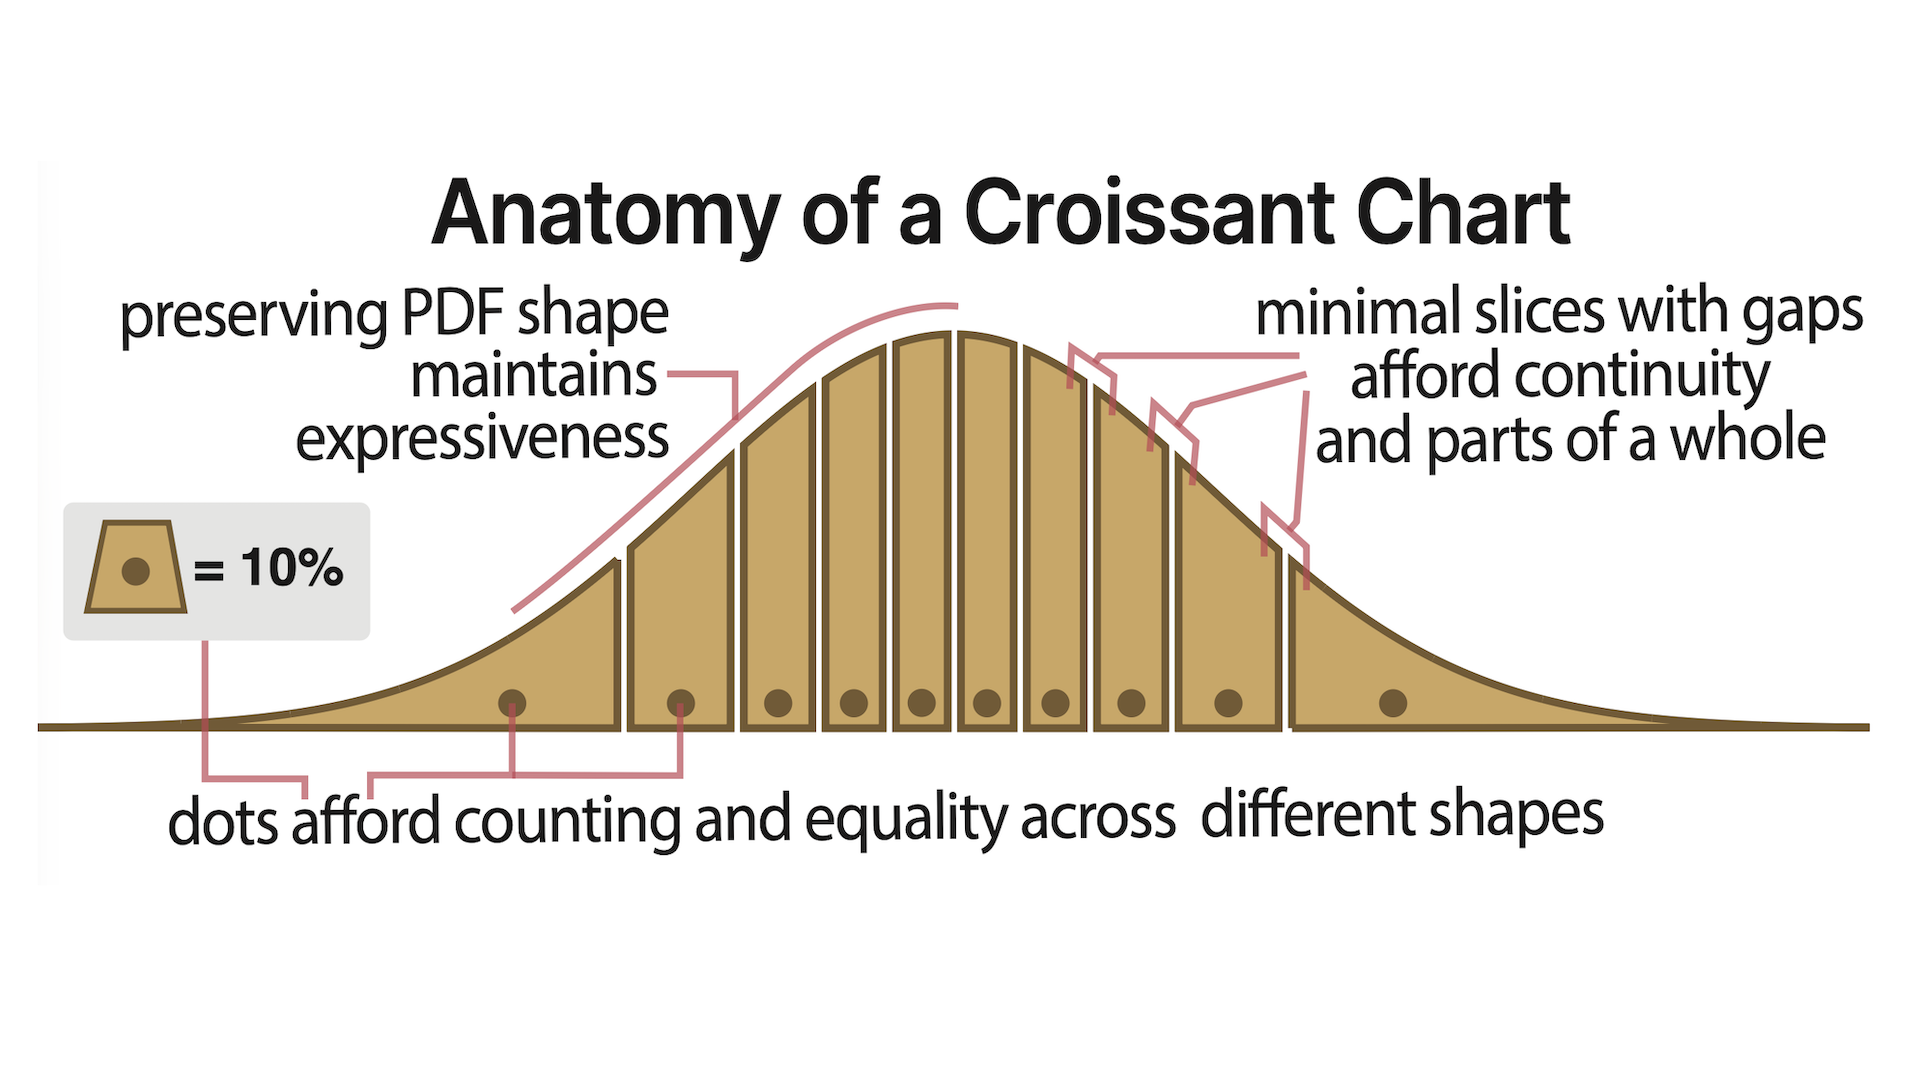
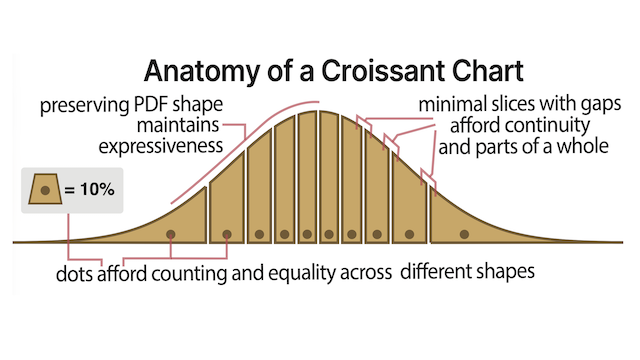
Croissant Charts: Modulating the Performance of Normal Distribution Visualizations with Affordances
Abstract
Affordances, originating in psychology, describe how an object’s design influences the physical and cognitive actions users may take. Past work applied affordance theory to visualization to explain how design decisions can impact the cognitive actions of visualization readers. In this work, we demonstrate that affordances can complement effectiveness rankings by further explaining the root causes behind visualizations’ task performance. To do so, we conduct a case study on static normal probability density function plots, identifying their current affordances. Next, we identify the optimal affordances for a common probability-comparison task and develop a novel affordance-driven visualization, the Croissant Chart, to support them. We empirically validate the design’s effectiveness through a preregistered study (n = 808), demonstrating how affordances can inform predictable changes in task performance. Our findings underscore the potential for affordance-based approaches to enhance visualization effectiveness and inform future design decisions.


Citation
Croissant Charts: Modulating the Performance of Normal Distribution Visualizations with Affordances
Racquel Fygenson, Enrico Bertini, and Lace M. Padilla. Computer Graphics Forum—EuroVis/CGF. 2026.
PDF | Preprint | Supplement | Preregistration | BibTeX
Khoury Vis Lab — Northeastern University
* West Village H, Room 302, 440 Huntington Ave, Boston, MA 02115, USA
* 100 Fore Street, Portland, ME 04101, USA
* Carnegie Hall, 201, 5000 MacArthur Blvd, Oakland, CA 94613, USA