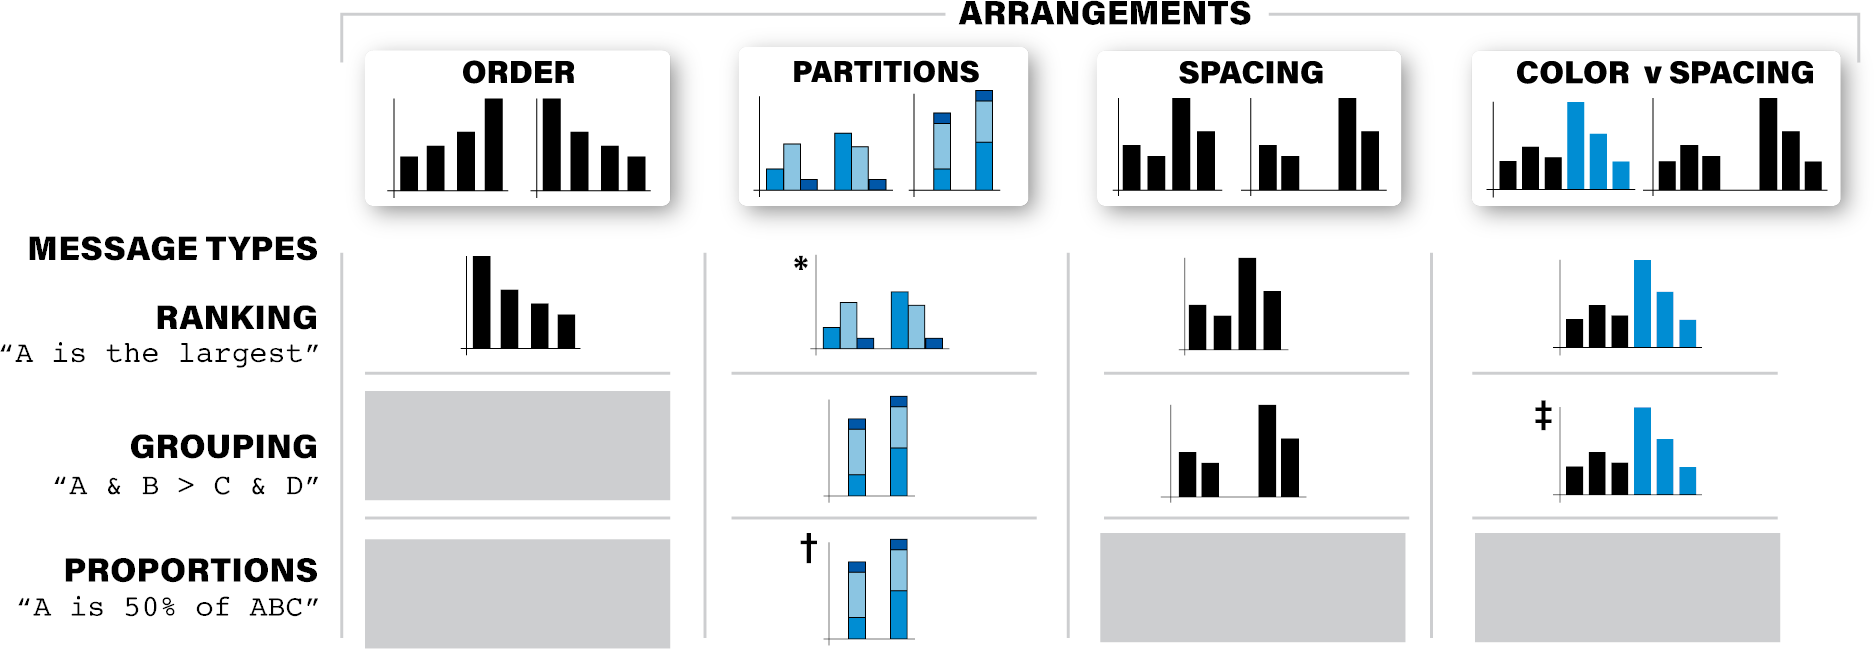
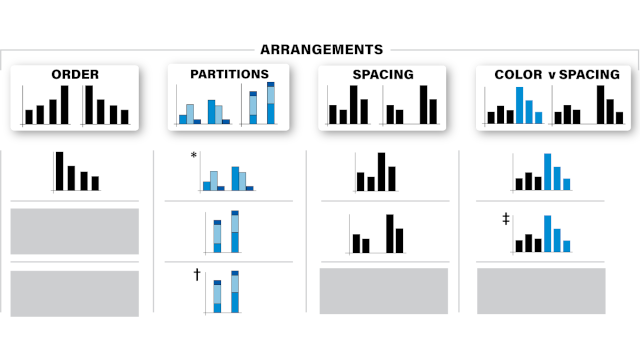
The arrangement of marks impacts afforded messages: ordering, partitioning, spacing, and coloring in bar charts

A 4 by 4 grid. In the top row are examples of the four types of arrangements tested in the paper. From left to right: ORDER shows two bar charts. One sorted in ascending order, the other in descending order. PARTITIONS shows two bar charts. One has bars stacked into two columns, each consisting of three smaller bars. The other shows the bars side-by-side.  SPACING shows two bar charts. One uniformly spaced, the other spaced to make two groups of bars. COLOR V SPACING shows two bar charts. One is uniformly spaced, using color to group the bars, while the other is uniformly colored, using spacing to group the bars. In the leftmost column, are three message types that were tested in the paper. From top to bottom: RANKING, the accompanying example is "A is the largest". GROUPING, the accompanying example is "A & B > C & D". PROPORTIONS the accompanying example is "A is 50% of ABC". Filling in the rest of the grid, is the graph type that makes each message type the most obvious. For the RANKING example "A is the largest", this includes a bar chart sorted in descending order from left-to-right as opposed to an ascending bar chart, a side-by-side bar chart as opposed to a stacked bar chart accompanied by a *,  a bar chart that is uniformly spaced as opposed to spaced into groups, a bar chart grouped by color as opposed to by spacing. For the GROUPING example "A & B >  C & D", a gray box indicating no response for the ordered bars, a stacked bar chart as opposed to a side-by-side bar chart, a bar chart that is grouped by space as opposed to uniformly spaced, and a bar chart grouped by color as opposed to grouped by spacing accompanied by a ‡. For the PROPORTIONS example "A is 50% of ABC", a gray box indicating no response for the ordered bars, a stacked bar chart as opposed to a side by side bar chart accompanied by a †, a gray box indicating no response for the differently spaced bars, and a gray box indicating no response for the color-grouped vs. space-grouped bars.
A sample of presented findings: each cell shows the best option we found. Column headers show the options we compared,and row headers show tested message types. Gray rectangles indicate that the corresponding message-arrangement was not studied.Of tested arrangements, ∗ is best when comparing individual parts and † is best when 3 colors are present – ‡ is best when2 colors are present. (2) (PDF) The Arrangement of Marks Impacts Afforded Messages: Ordering, Partitioning, Spacing, and Coloring in Bar Charts.
Abstract
Data visualizations present a massive number of potential messages to an observer. One might notice that one group's average is larger than another's, or that a difference in values is smaller than a difference between two others, or any of a combinatorial explosion of other possibilities. The message that a viewer tends to notice-the message that a visualization 'affords'-is strongly affected by how values are arranged in a chart, e.g., how the values are colored or positioned. Although understanding the mapping between a chart's arrangement and what viewers tend to notice is critical for creating guidelines and recommendation systems, current empirical work is insufficient to lay out clear r ules. We present a set of empirical evaluations of how different messages-including ranking, grouping, and part-to-whole relationships-are afforded by variations in ordering, partitioning, spacing, and coloring of values, within the ubiquitous case study of bar graphs. In doing so, we introduce a quantitative method that is easily scalable, reviewable, and replicable, laying groundwork for further investigation of the effects of arrangement on message affordances across other visualizations and tasks. Pre-registration and all supplemental materials are available at https://osf.io/np3q7and https://osf.io/bvy95, respectively.
Materials
PDF | Preprint | Supplement | Preregistration | BibTeX
Authors
Citation

Khoury Vis Lab — Northeastern University
West Village H, Room 302
440 Huntington Ave, Boston, MA 02115, USA