Quantitative, qualitative, and historical urban data visualization tools for professionals and stakeholders

Abstract
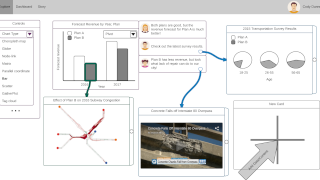
Existing technologies for transportation planning, urban design, and decision-making have not kept pace with rapid urbanization. Visualization and analysis tools can help by combining qualitative, quantitative, and historical urban data — helping experts understand the system of systems of the modern city. Incorporating insights from experts in several relevant fields, we have derived a performance specification for visualization tools supporting general transportation planning problems . We examine two existing technologies against the specification — Betaville and StoryFacets — and recommend adapting them as first-generation urban system analysis/planning support tools. We also suggest guidelines for the next generation of tools for transportation planning.
Authors

Citation
Quantitative, qualitative, and historical urban data visualization tools for professionals and stakeholders
Cody Dunne, Carl Skelton, Sara Diamond, Isabel Meirelles, and Mauro Martino. Proc. Distributed, Ambient and Pervasive Interactions, Held as Part of HCI International—DAPI. 2016. DOI: 10.1007/978-3-319-39862-4_37
Khoury Vis Lab — Northeastern University
* West Village H, Room 302, 440 Huntington Ave, Boston, MA 02115, USA
* 100 Fore Street, Portland, ME 04101, USA
* Carnegie Hall, 201, 5000 MacArthur Blvd, Oakland, CA 94613, USA