Sequence Braiding: Visual overviews of temporal event sequences and attributes
Abstract
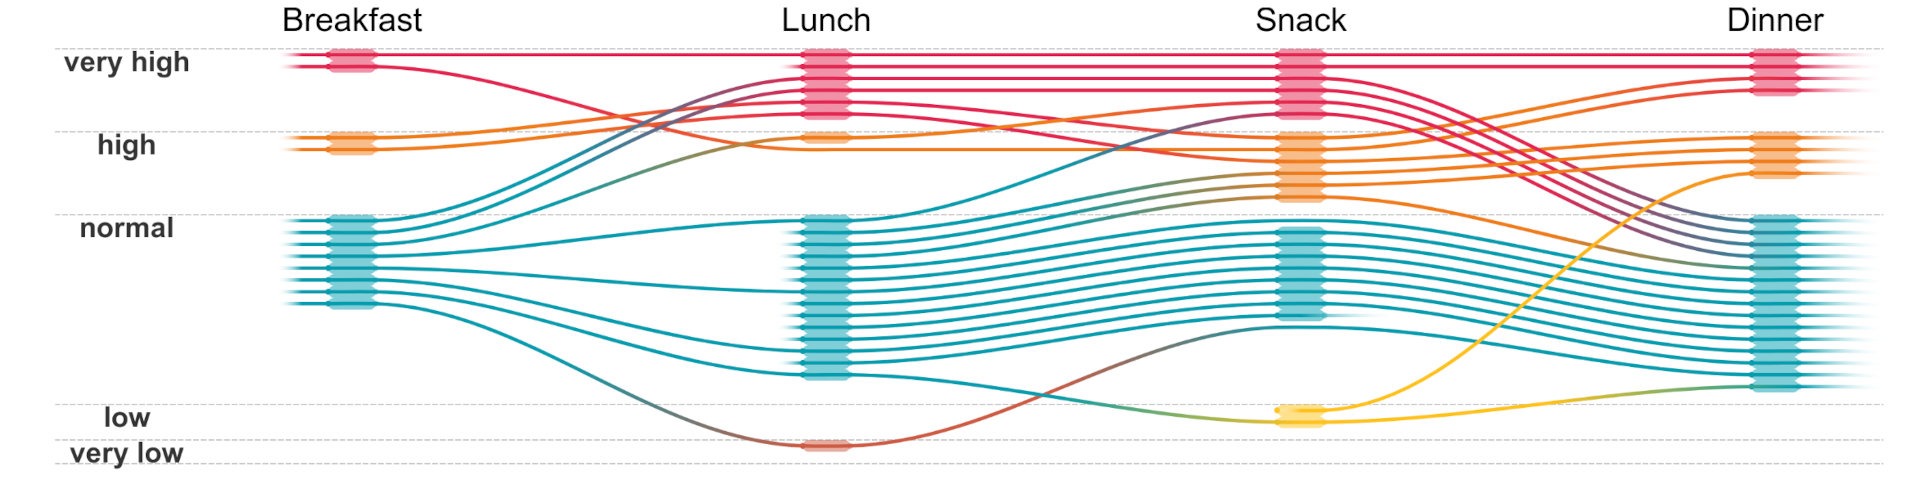
Temporal event sequence alignment has been used in many domains to visualize nuanced changes and interactions over time. Existing approaches align one or two sentinel events. Overview tasks require examining all alignments of interest using interaction and time or juxtaposition of many visualizations. Furthermore, any event attribute overviews are not closely tied to sequence visualizations. We present SEQUENCE BRAIDING, a novel overview visualization for temporal event sequences and attributes using a layered directed acyclic network. SEQUENCE BRAIDING visually aligns many temporal events and attribute groups simultaneously and supports arbitrary ordering, absence, and duplication of events. In a controlled experiment we compare SEQUENCE BRAIDING and IDMVis on user task completion time, correctness, error, and confidence. Our results provide good evidence that users of SEQUENCE BRAIDING can understand high-level patterns and trends faster and with similar error. A full version of this paper with all appendices; the evaluation stimuli, data, and analysis code; and source code are available at osf.io/mq2wt.
Materials
PDF | Preprint | DOI | Homepage | Supplement | Code | Video Preview | Video Preview (Archive) | Video Presentation | Video Presentation (Archive) | BibTeX


Citation
Sequence Braiding: Visual overviews of temporal event sequences and attributes
Sara Di Bartolomeo, Yixuan Zhang, Fangfang Sheng, and Cody Dunne. IEEE Transactions on Visualization and Computer Graphics—VIS/TVCG. 2020. DOI: 10.1109/TVCG.2020.3030442
PDF | Preprint | DOI | Homepage | Supplement | Code | Video Preview | Video Preview (Archive) | Video Presentation | Video Presentation (Archive) | BibTeX
Khoury Vis Lab — Northeastern University
* West Village H, Room 302, 440 Huntington Ave, Boston, MA 02115, USA
* 100 Fore Street, Portland, ME 04101, USA
* Carnegie Hall, 201, 5000 MacArthur Blvd, Oakland, CA 94613, USA