Eye fixation metrics for large scale evaluation and comparison of information visualizations
Abstract
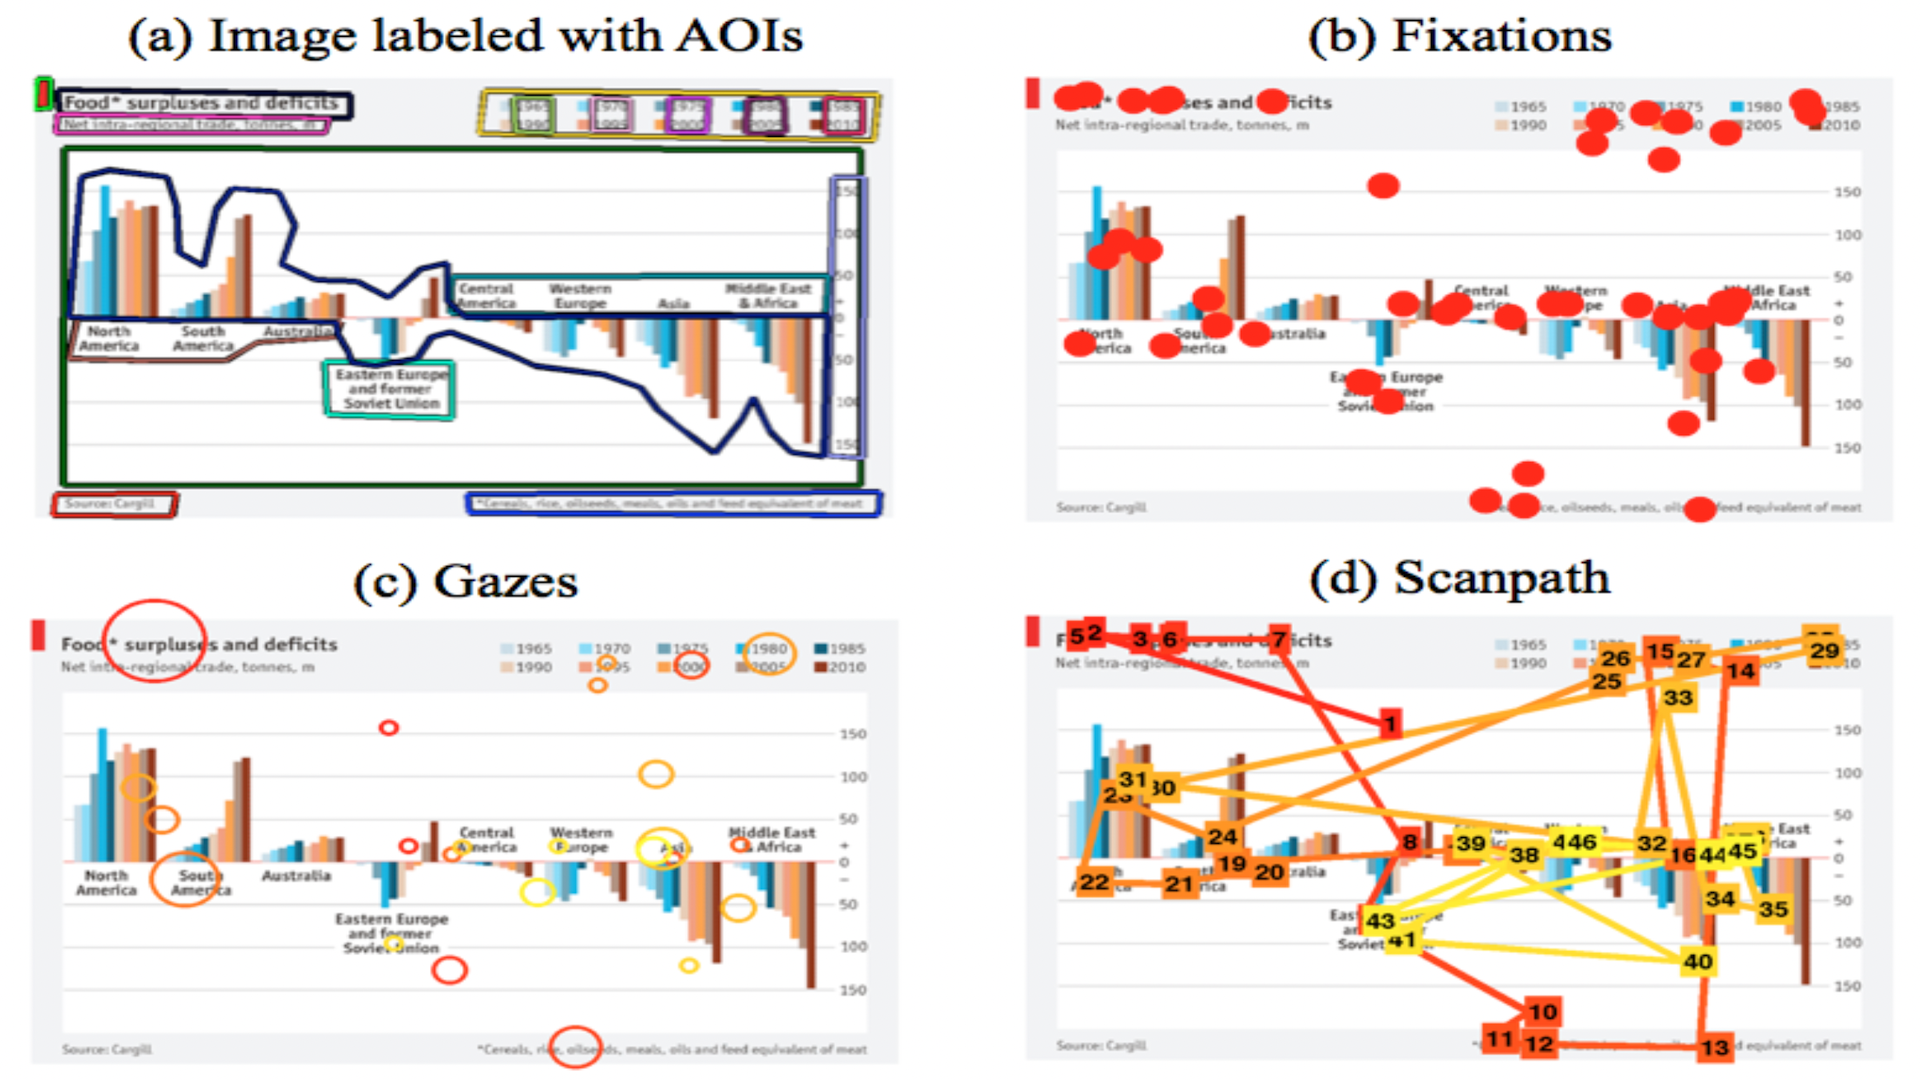
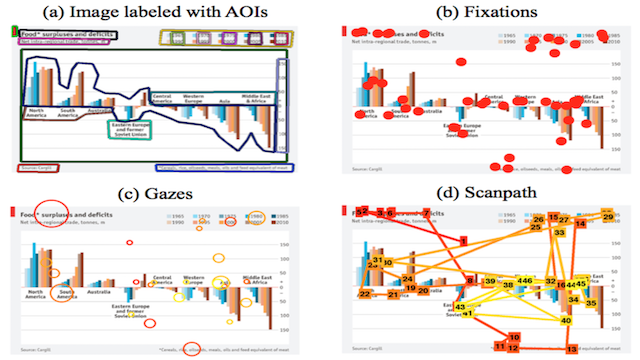
An observer's eye movements are often informative about how the observer interacts with and processes a visual stimulus. Here, we are specifically interested in what eye movements reveal about how the content of information visualizations is processed. Conversely, by pooling over many observers’ worth of eye movements, what can we learn about the general effectiveness of different visualizations and the underlying design principles employed? The contribution of this manuscript is to consider these questions at a large data scale, with thousands of eye fixations on hundreds of diverse information visualizations. We survey existing methods and metrics for collective eye movement analysis, and consider what each can tell us about the overall effectiveness of different information visualizations and designs at this large data scale.
Authors

Citation
Eye fixation metrics for large scale evaluation and comparison of information visualizations
Zoya Bylinskii, Michelle A. Borkin, Nam Wook Kim, Hanspeter Pfister, and Aude Oliva. Workshop on Eye Tracking and Visualization—ETVIS. 2015. DOI: 10.1007/978-3-319-47024-5_14
Khoury Vis Lab — Northeastern University
* West Village H, Room 302, 440 Huntington Ave, Boston, MA 02115, USA
* 100 Fore Street, Portland, ME 04101, USA
* Carnegie Hall, 201, 5000 MacArthur Blvd, Oakland, CA 94613, USA