Untidy data: the unreasonable effectiveness of tables
Abstract
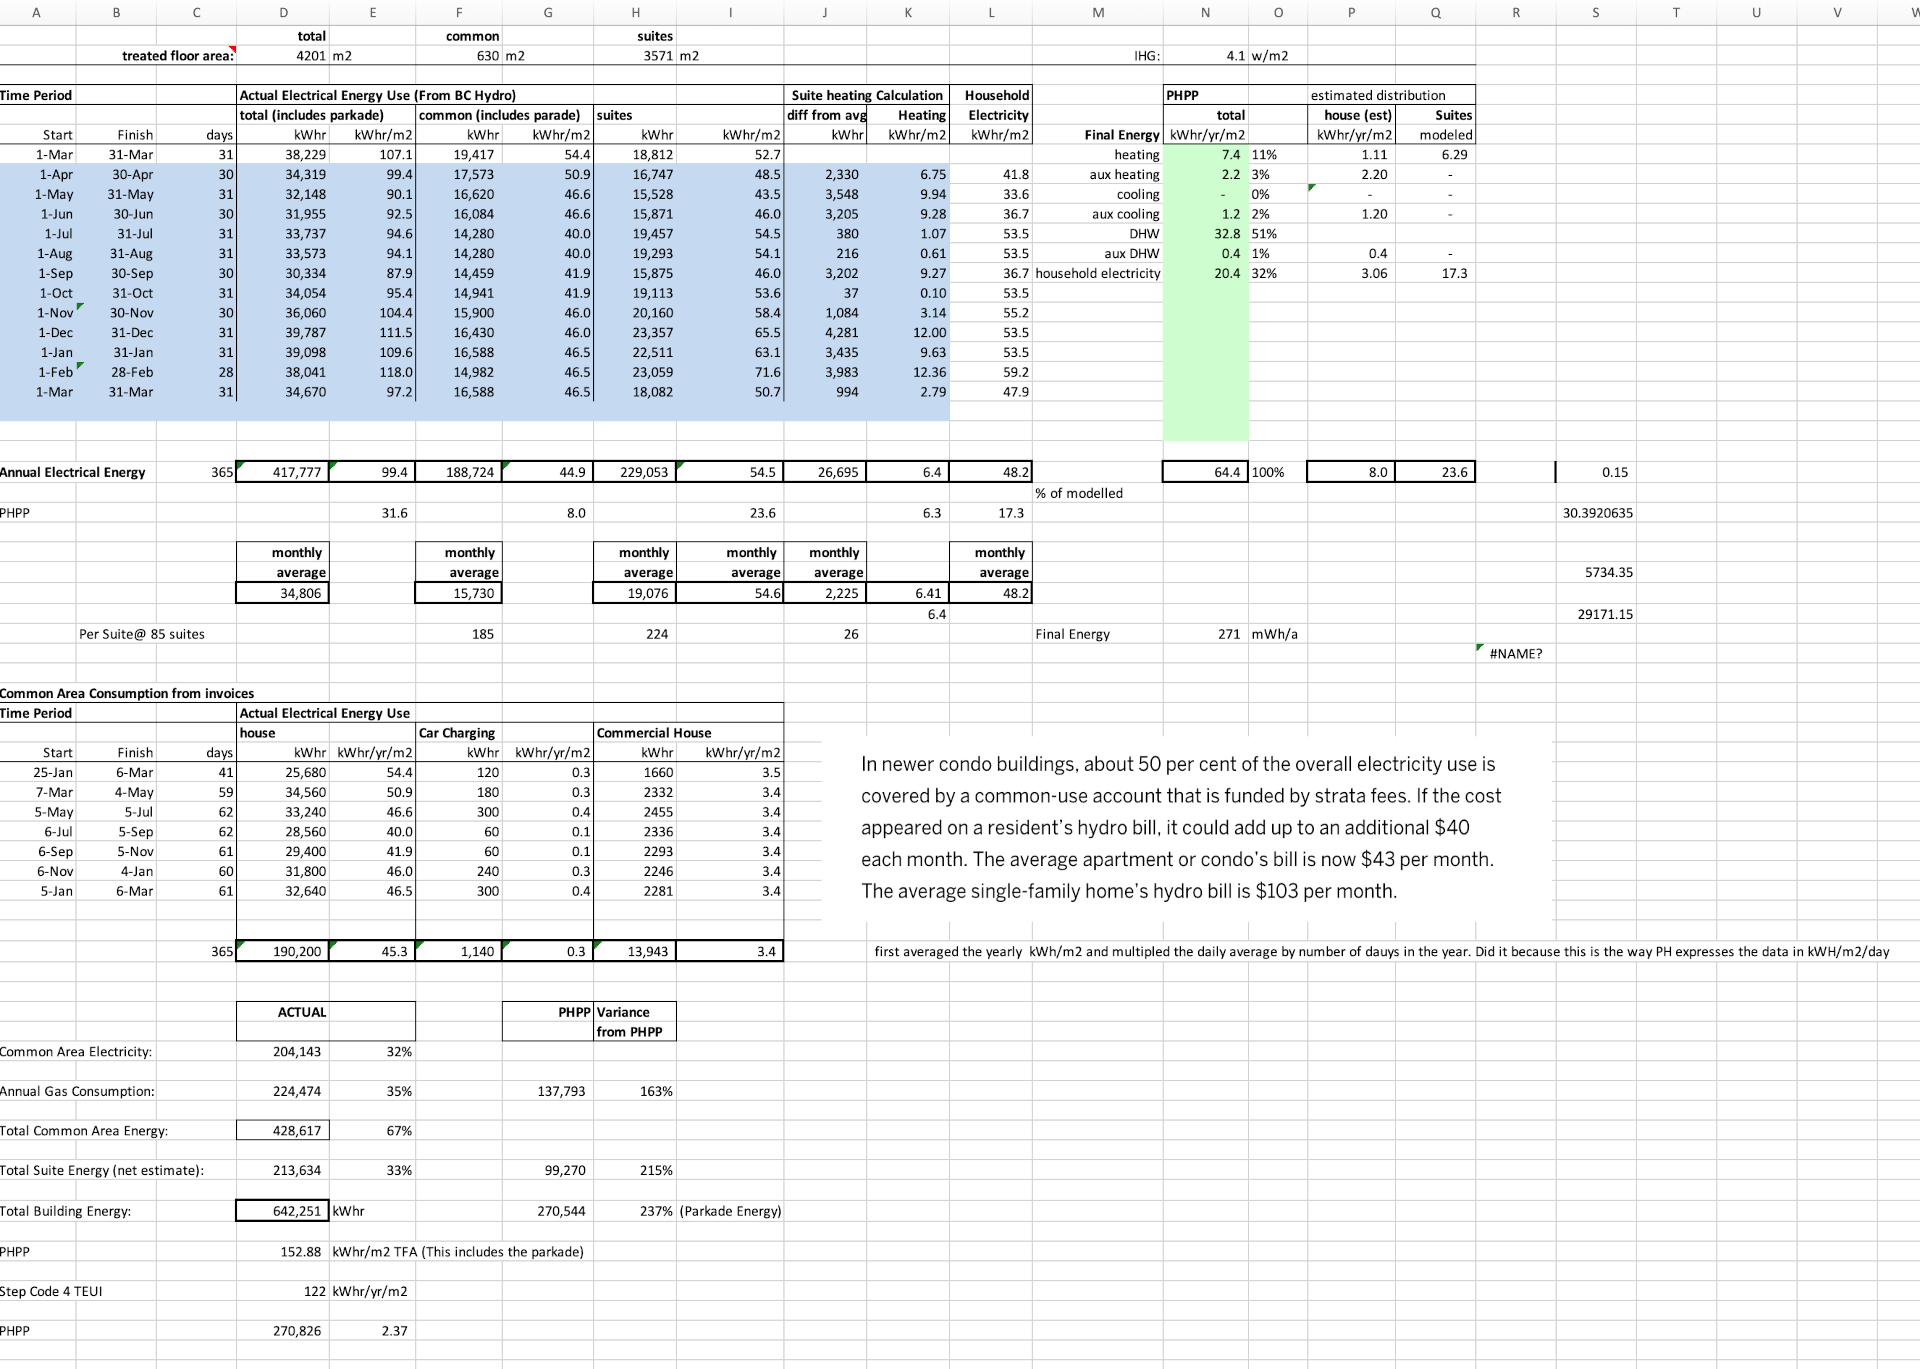
Working with data in table form is usually considered a preparatory and tedious step in the sensemaking pipeline; a way of getting the data ready for more sophisticated visualization and analytical tools. But for many people, spreadsheets — the quintessential table tool — remain a critical part of their information ecosystem, allowing them to interact with their data in ways that are hidden or abstracted in more complex tools. This is particularly true for data workers [61], people who work with data as part of their job but do not identify as professional analysts or data scientists. We report on a qualitative study of how these workers interact with and reason about their data. Our findings show that data tables serve a broader purpose beyond data cleanup at the initial stage of a linear analytic flow: users want to see and “get their hands on” the underlying data throughout the analytics process, reshaping and augmenting it to support sensemaking. They reorganize, mark up, layer on levels of detail, and spawn alternatives within the context of the base data. These direct interactions and human-readable table representations form a rich and cognitively important part of building understanding of what the data mean and what they can do with it. We argue that interactive tables are an important visualization idiom in their own right; that the direct data interaction they afford offers a fertile design space for visual analytics; and that sense making can be enriched by more flexible human-data interaction than is currently supported in visual analytics tools.
Authors


Citation
Untidy data: the unreasonable effectiveness of tables
Lyn Bartram, Michael Correll, and Melanie Tory. IEEE Transactions on Visualization and Computer Graphics—TVCG. 2021. DOI: 10.1109/TVCG.2021.3114830
Khoury Vis Lab — Northeastern University
* West Village H, Room 302, 440 Huntington Ave, Boston, MA 02115, USA
* 100 Fore Street, Portland, ME 04101, USA
* Carnegie Hall, 201, 5000 MacArthur Blvd, Oakland, CA 94613, USA