DevOps for DataVis: a survey and provocation for teaching deployment of data visualizations
Abstract
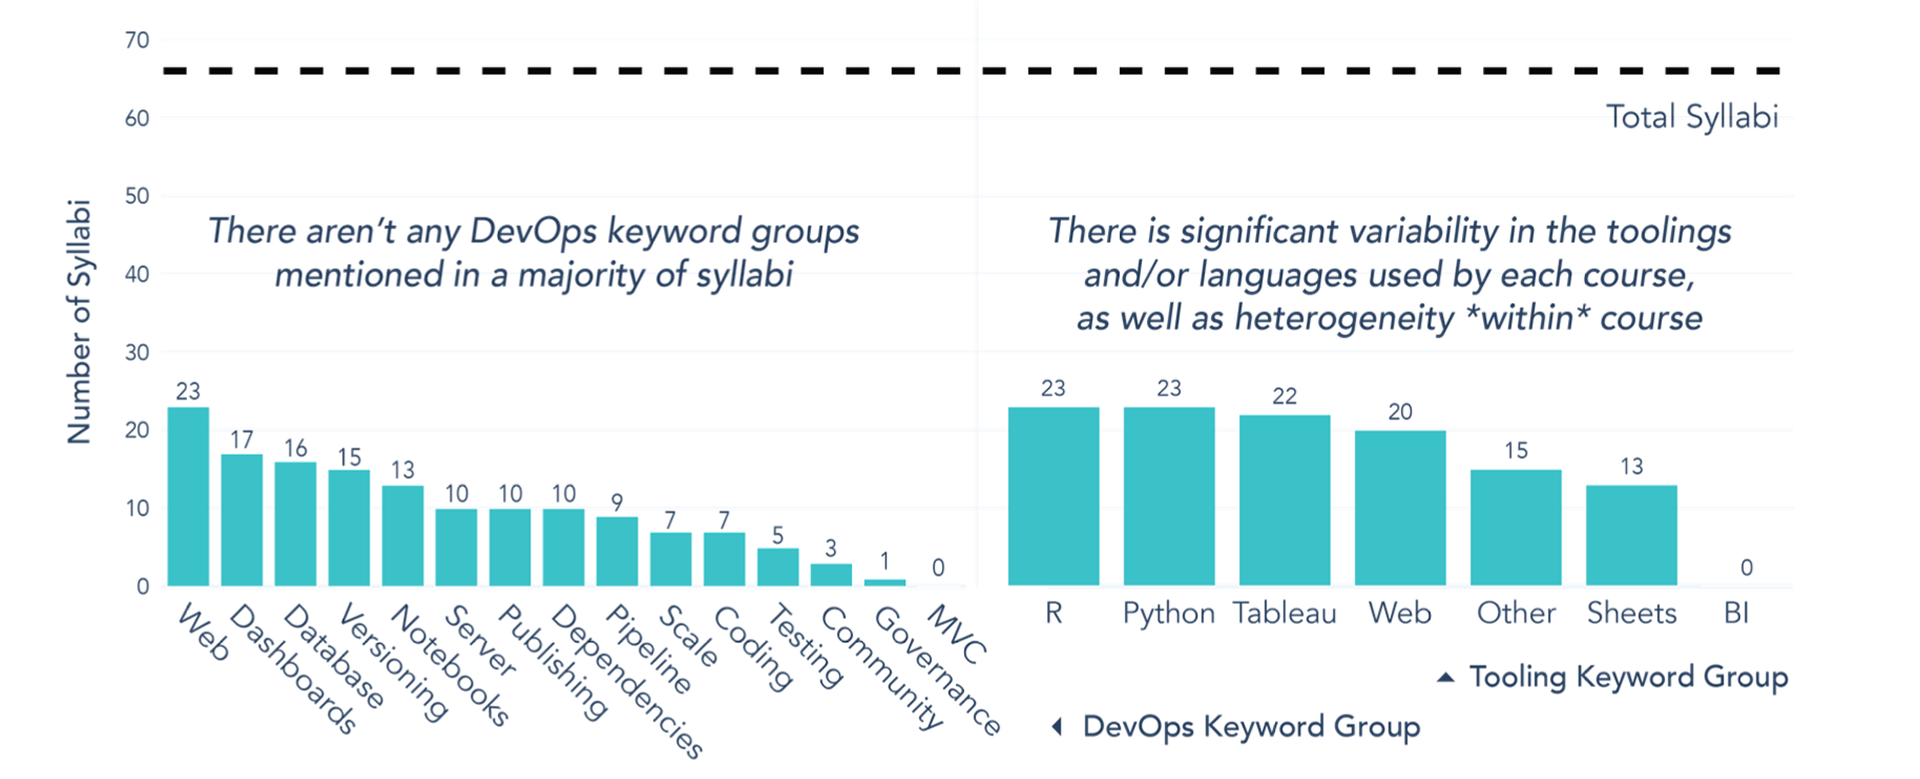
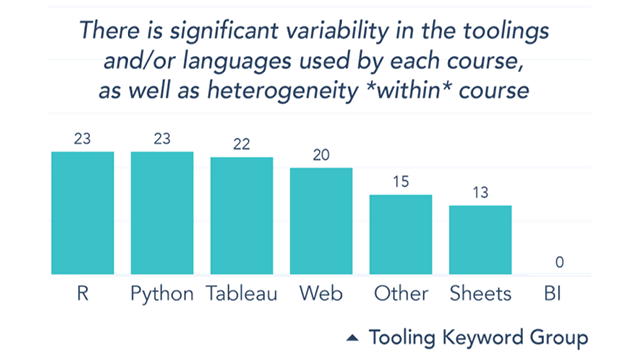
We present a provocation towards teaching development operations ("DevOps") and other infrastructure concepts in the course of collegiate data visualization instruction. We survey 65 syllabi from semester-long, college-level data visualization courses, with an eye toward languages and platforms used, as well as mentions of deployment related terms. Results convey significant variability in language and tooling used in curricula. We identify a distinct lack of discussions around ‘DevOps for DataVis’ scaffolding concepts such as version control, package management, server infrastructure, high-performance computing, and machine learning data pipelines. We acknowledge the challenges of adding supplemental information to already dense curricula, and the expectation that prior or concurrent classes should provide this computer science background. We propose a group community effort to create one free ‘course’ or ‘wiki’ as a living reference on the ways these broader DevOps concepts relate directly to data visualization specifically. A free copy of this paper and all supplemental materials are available at osf.io/bxaqz.
Materials
PDF | Preprint | DOI | Supplement | BibTeX | alt.VIS 2023 Most Frustration-Motivated Award!Authors

Citation
DevOps for DataVis: a survey and provocation for teaching deployment of data visualizations
Jane Adams. Proc. alt.VIS workshop at IEEE VIS—alt.VIS. 2023. DOI: 10.31219/osf.io/ub539
PDF | Preprint | DOI | Supplement | BibTeX | alt.VIS 2023 Most Frustration-Motivated Award!
Khoury Vis Lab — Northeastern University
* West Village H, Room 302, 440 Huntington Ave, Boston, MA 02115, USA
* 100 Fore Street, Portland, ME 04101, USA
* Carnegie Hall, 201, 5000 MacArthur Blvd, Oakland, CA 94613, USA