Designing visualization dashboards for aligning experimental and analytical results in systems genetics addiction research
Abstract
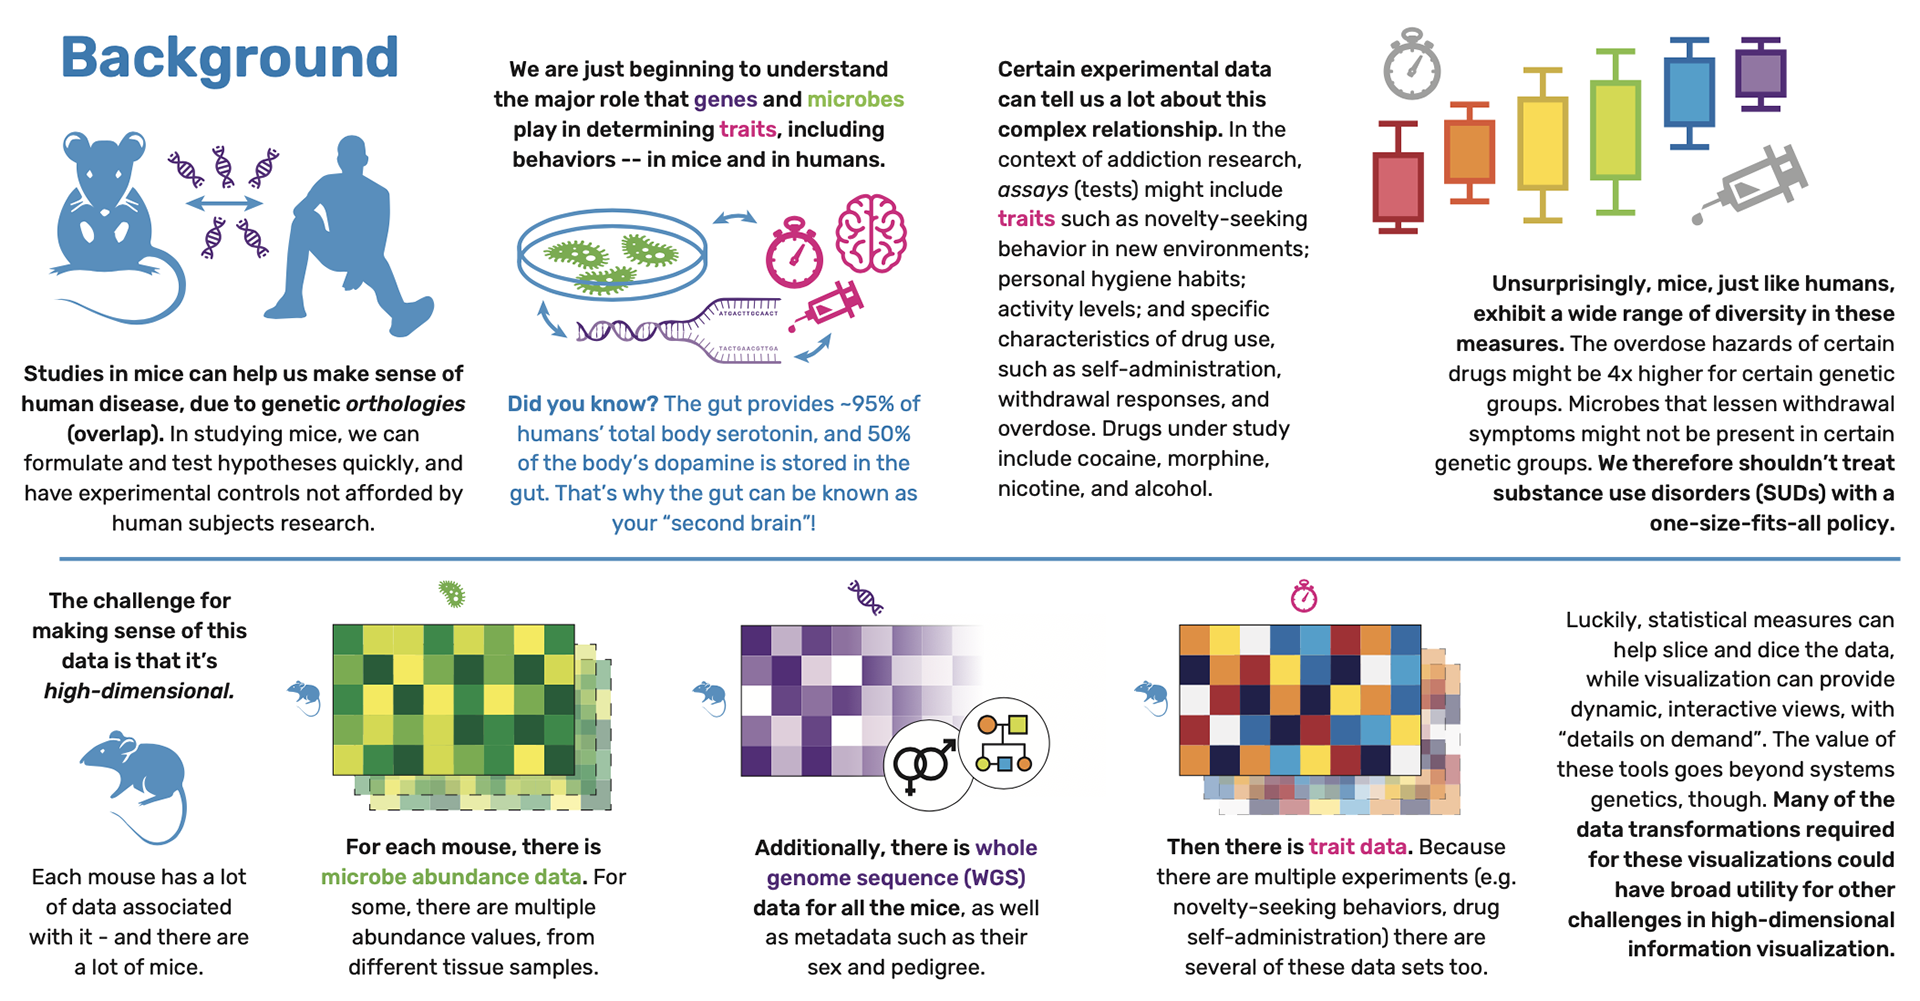
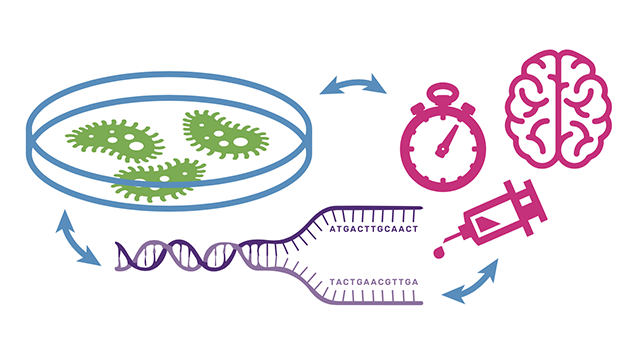
We introduce three data visualization projects related to systems genetics and addiction research. Historically, the challenge of biology research has been one of data collection. However, as measurement becomes easier, the challenge shifts towards data sensemaking. Here, researchers are asking questions about the relationships between genes, traits, and the microbiome, using visualization for data exploration. This work has implications for visualization of high-dimensional data in other domains, as it shows how statistical methods can support visualization filtering, aggregation, and information hierarchies to explore dense data.
Authors


Citation
Designing visualization dashboards for aligning experimental and analytical results in systems genetics addiction research
Jane Adams, Robyn Ball, Jason Bubier, Elissa Chesler, and Michelle A. Borkin. Gordon Research Conference (GRC). 2023.
Khoury Vis Lab — Northeastern University
* West Village H, Room 302, 440 Huntington Ave, Boston, MA 02115, USA
* 100 Fore Street, Portland, ME 04101, USA
* Carnegie Hall, 201, 5000 MacArthur Blvd, Oakland, CA 94613, USA