Ready player viz: player-created data visualizations for video games
Abstract
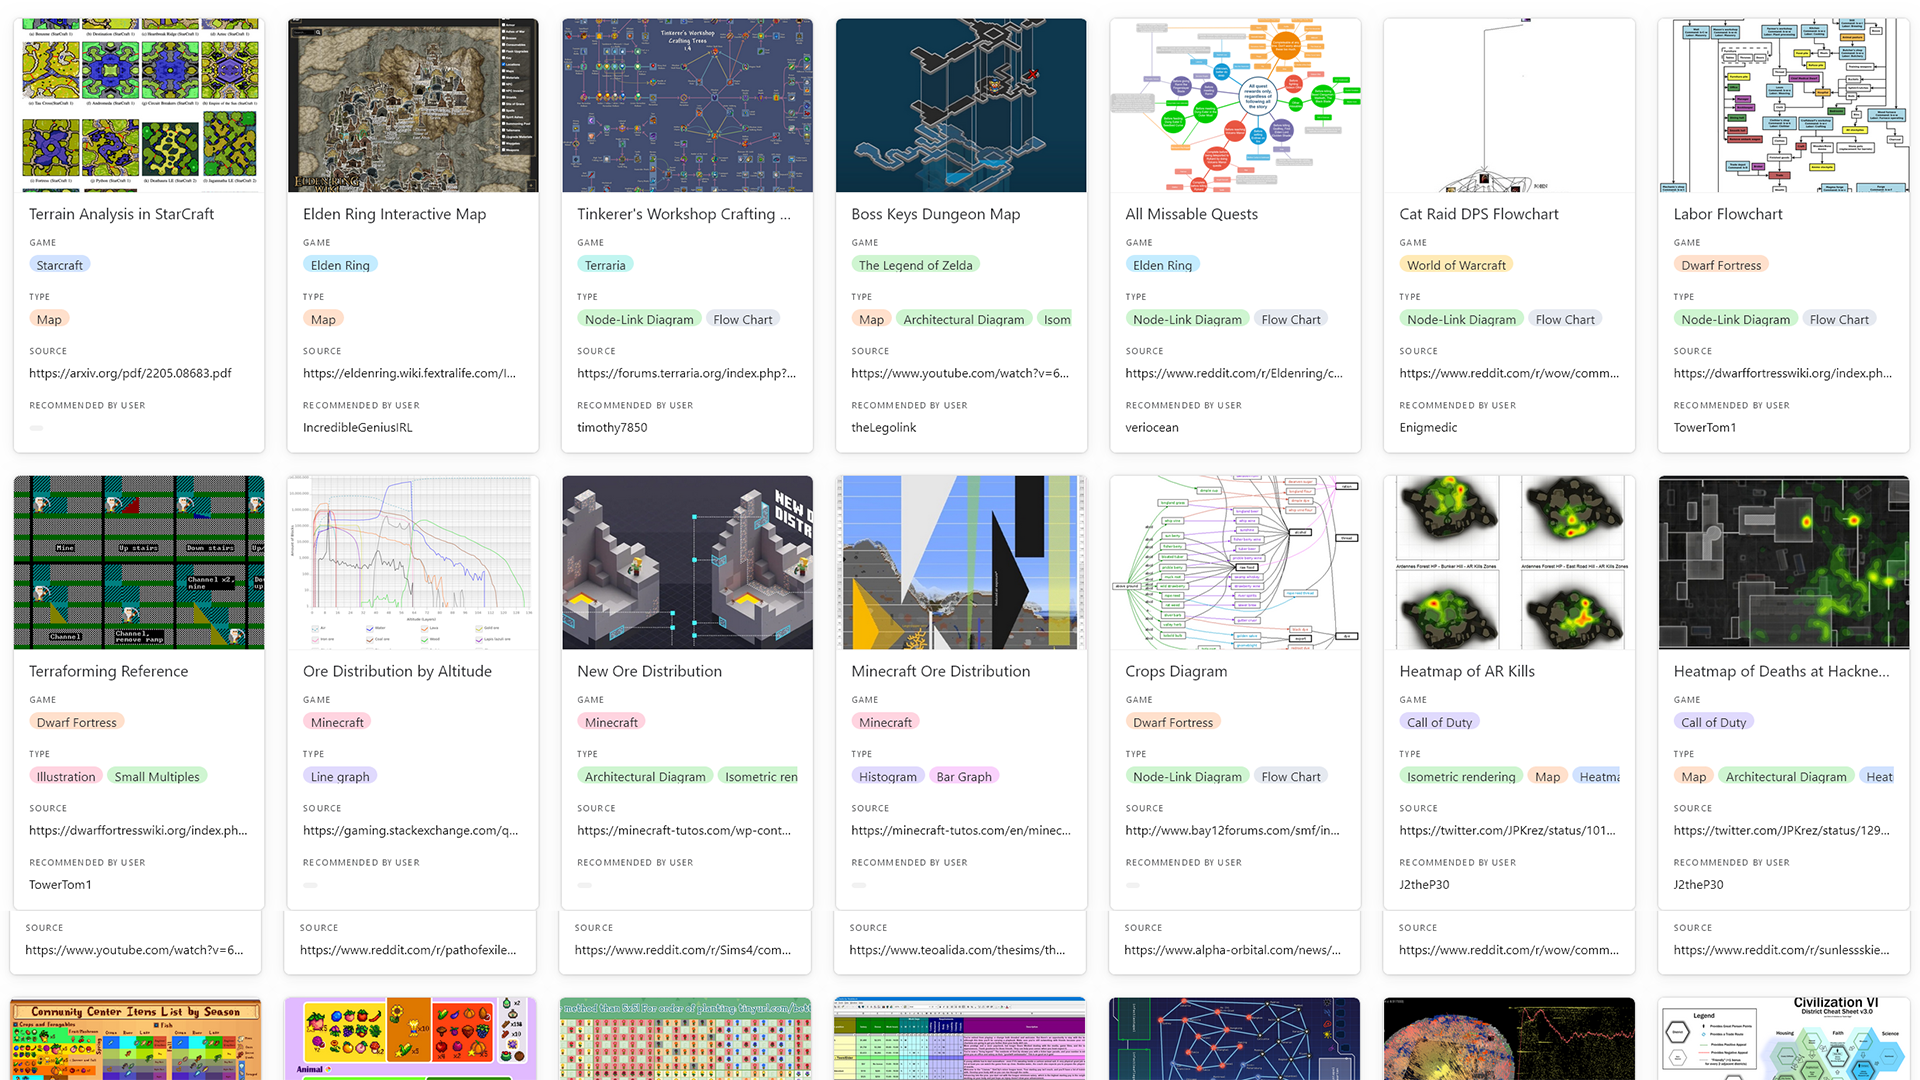
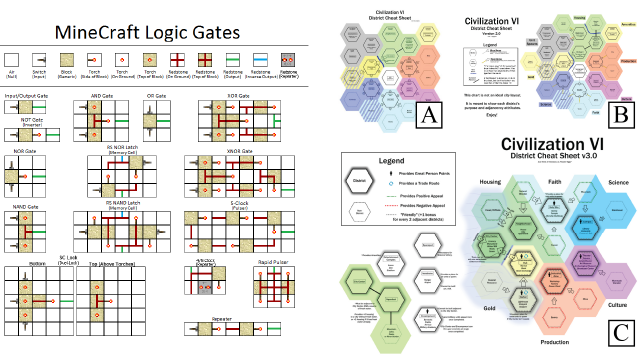
We present a survey of the design space of player-created strategic visualizations for video games, to better understand how players make sense of complex game mechanics and incorporate feedback from fellow players. We present several examples of these visualizations, and contrast them to developer-created visualizations, both in information presentation and purpose. We find that there is a rich community-building aspect to visualization development within game 'fandoms', facilitated by cross-platform exchange and iterative development, including: social media, informational 'wikis', and in-game modifications ('modding'). Finally, we consider player-created visualizations in the context of a broader imagining about the future of visualization development for non-game but analogous strategic applications. We maintain a collection of tagged and categorized examples of player-created video game visualizations here.
Authors

Michael Davinroy
Citation
Ready player viz: player-created data visualizations for video games
Jane Adams and Michael Davinroy. Proc. alt.VIS workshop at IEEE VIS—alt.VIS. 2022. DOI: 10.31219/osf.io/vkmsr
Khoury Vis Lab — Northeastern University
* West Village H, Room 302, 440 Huntington Ave, Boston, MA 02115, USA
* 100 Fore Street, Portland, ME 04101, USA
* Carnegie Hall, 201, 5000 MacArthur Blvd, Oakland, CA 94613, USA