Visual Analytics Applied to the Monitoring of High-Cost Medicines used in Rheumatology, in a Hospital of High Complexity in Latin America
Abstract
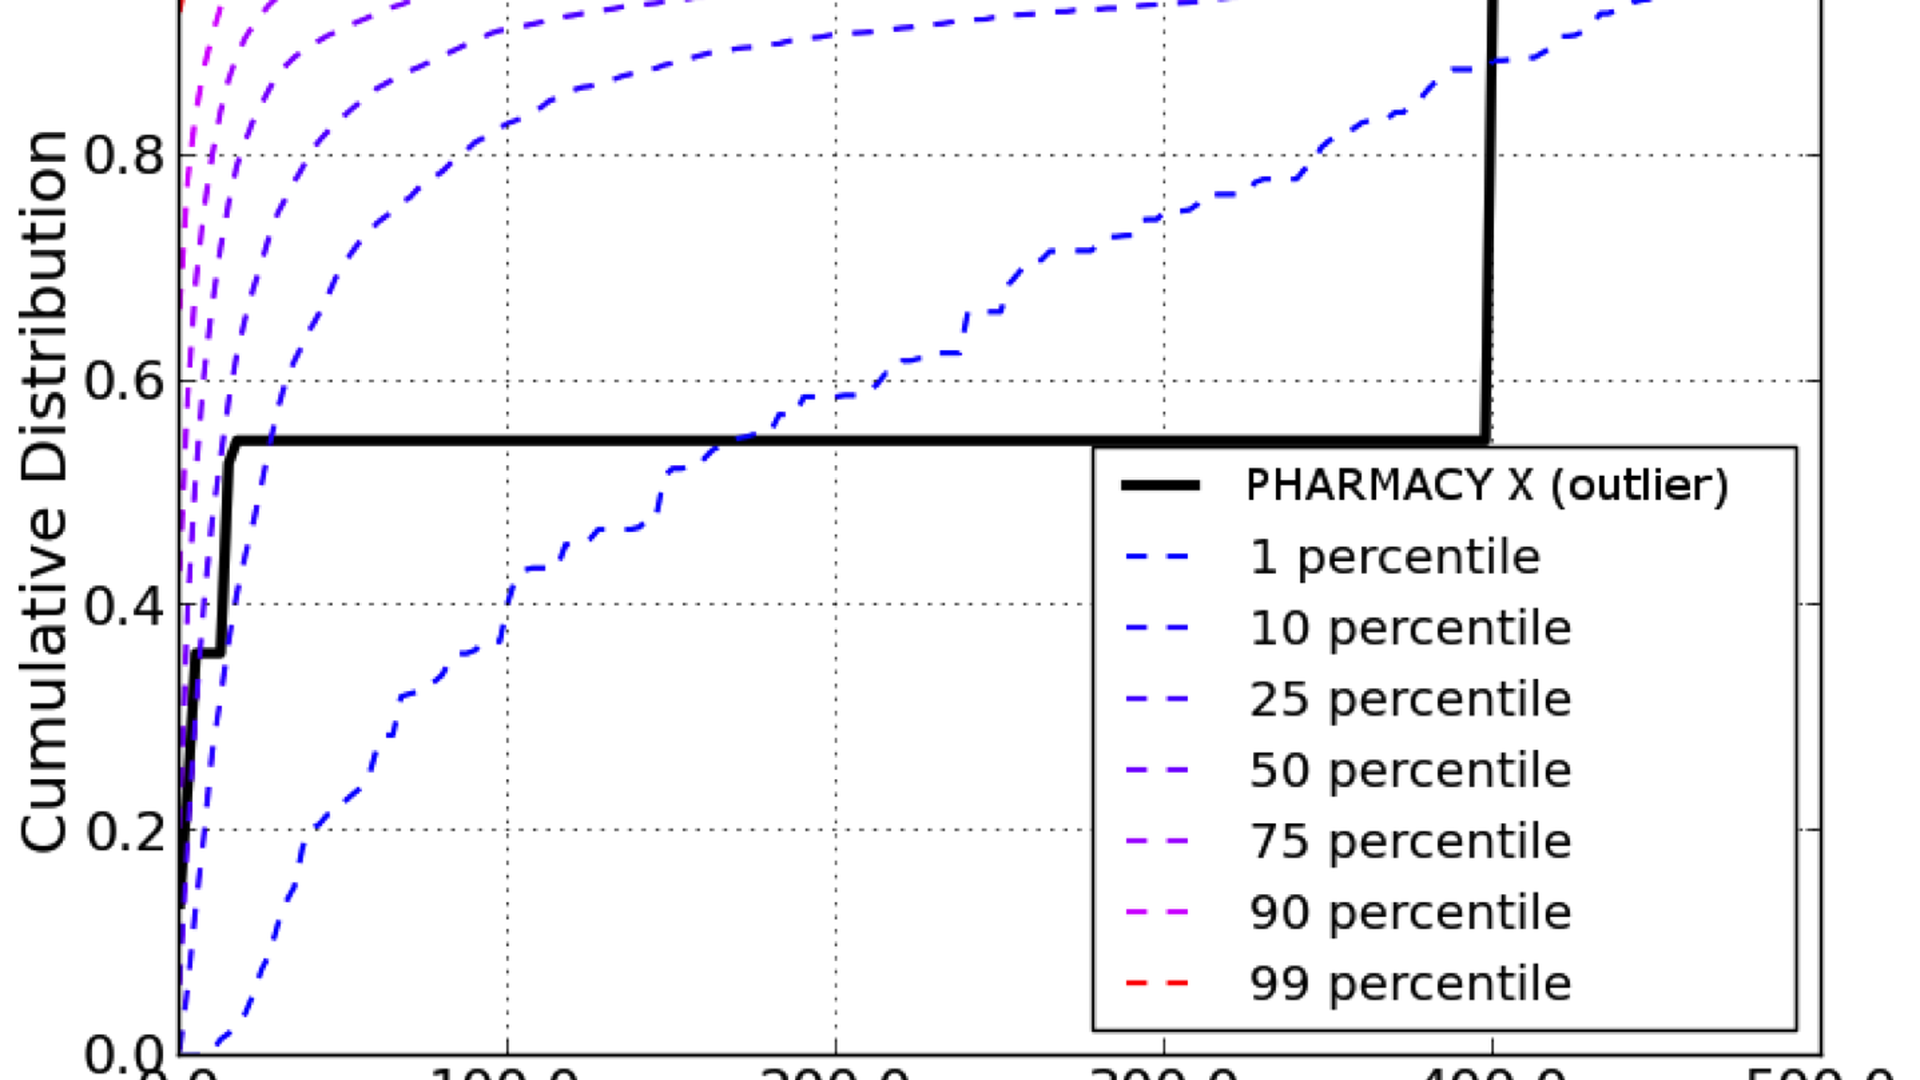
This poster presents a visual analytics application for monitoring the use of high-cost medicines in a rheumatology department of a high-complexity Latin American hospital. The tool helps clinicians and administrators understand prescription patterns and resource utilization.
Authors
Armando Acosta
Ricardo Portocarrero
Adriana Beltran Ostos
Hoover Quitian Reyes
Camila Camargo Rodriguez
Sergio Moreno
John Guerra-Gomez
Citation
Visual Analytics Applied to the Monitoring of High-Cost Medicines used in Rheumatology, in a Hospital of High Complexity in Latin America
Armando Acosta, Ricardo Portocarrero, Adriana Beltran Ostos, Hoover Quitian Reyes, Camila Camargo Rodriguez, Sergio Moreno, and John Guerra-Gomez. Proc. PANLAR—PANLAR. 2020.
Khoury Vis Lab — Northeastern University
* West Village H, Room 302, 440 Huntington Ave, Boston, MA 02115, USA
* 100 Fore Street, Portland, ME 04101, USA
* Carnegie Hall, 201, 5000 MacArthur Blvd, Oakland, CA 94613, USA