Fast and readable layered network visualizations using large neighborhood search
Abstract
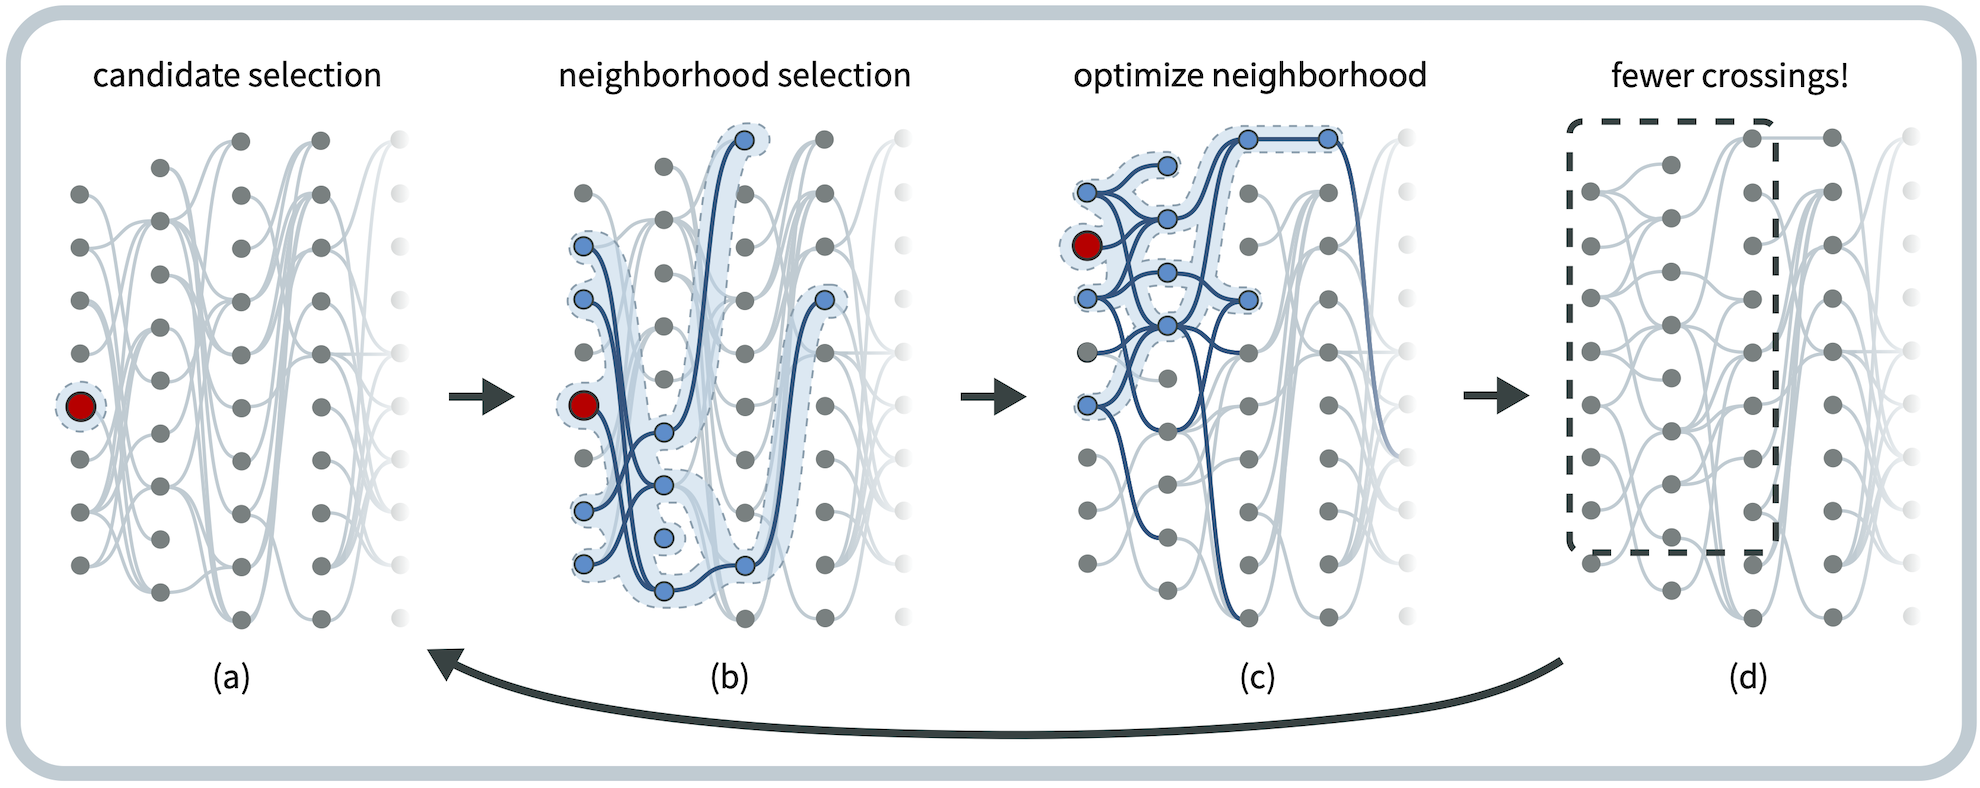
Layered network visualizations assign each node to one of several parallel axes. They can convey sequence or flow data, hierarchies, or multiple data classes, but edge crossings and long edges often impair readability. Layout algorithms can reduce edge crossings and shorten edges using quick heuristics or optimal methods that prioritize human readability over computation speed. This work uses an optimization metaheuristic to provide the best of both worlds: high-quality layouts within a predetermined execution time. Our adaptation of the large neighborhood search (LNS) metaheuristic repeatedly selects fixed-sized subgraphs to lay out optimally. We conducted a computational evaluation using 450 synthetic networks to compare five ways of selecting candidate nodes, four ways of selecting their neighboring subgraph, and three criteria for determining subgraph size. LNS generally halved the number of crossings vs. the barycentric heuristic while maintaining a reasonable runtime. Our best approach randomly selected candidate nodes, used degree centrality to pick cluster-like neighborhoods, and chose smaller neighborhoods that could be optimally laid out in 0.6 or 1.2 seconds (vs. 6 seconds). In a case study visualizing 13 control flow graphs, most with over 1000 nodes, we show that our method can be employed to create visualizations with fewer crossings than Tabu Search, another metaheuristic, and vastly outperforms an ILP solver when runtime is bounded. A free copy of this paper and all supplemental materials are available at osf.io/w3fev/.


Citation

Fast and readable layered network visualizations using large neighborhood search
Connor Wilson, Tarik Crnovrsanin, Eduardo Puerta, and Cody Dunne. IEEE Transactions on Visualization and Computer Graphics—TVCG. 2025. DOI: 10.1109/TVCG.2025.3537898
PDF | Preprint | DOI | Supplement | BibTeX
Khoury Vis Lab — Northeastern University
* West Village H, Room 302, 440 Huntington Ave, Boston, MA 02115, USA
* 100 Fore Street, Portland, ME 04101, USA
* Carnegie Hall, 201, 5000 MacArthur Blvd, Oakland, CA 94613, USA