Scalable Scalable Vector Graphics: Automatic translation of interactive SVGs to a multithread VDOM for fast rendering
Abstract
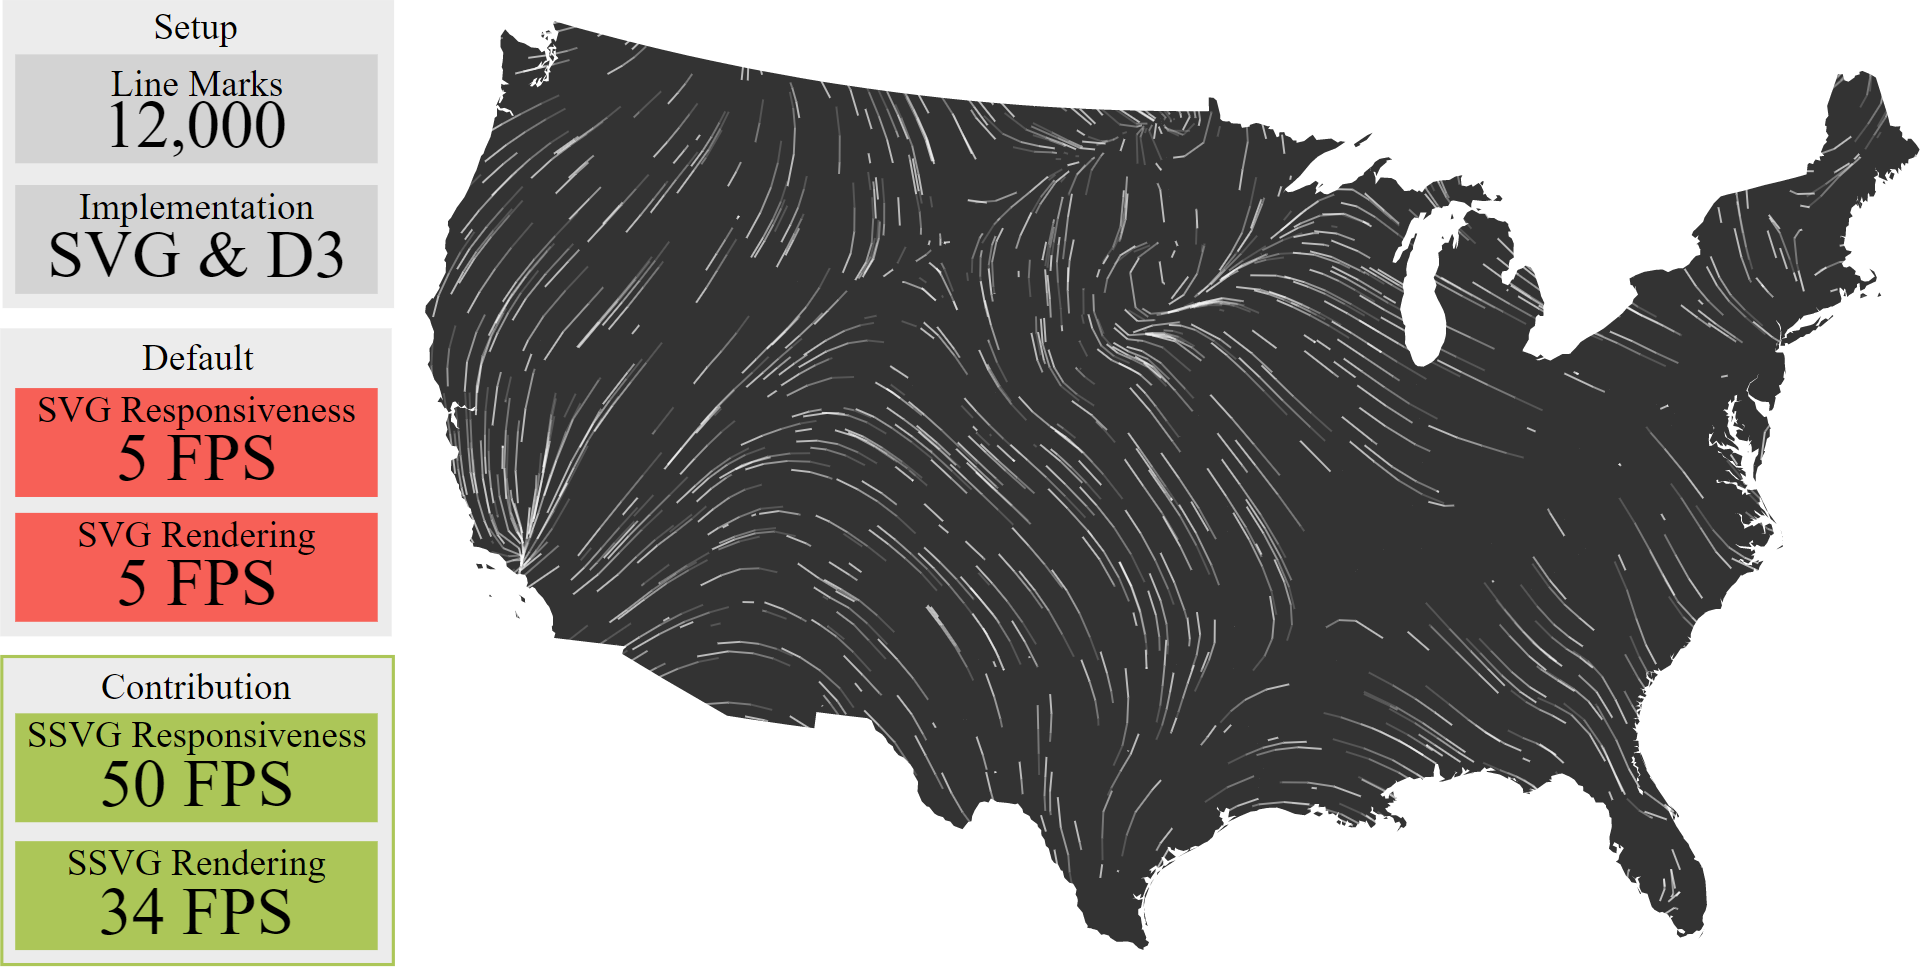
The dominant markup language for Web visualizations—Scalable Vector Graphics (SVG)—is comparatively easy to learn, and is open, accessible, customizable via CSS, and searchable via the DOM, with easy interaction handling and debugging. Because these attributes allow visualization creators to focus on design on implementation details, tools built on top of SVG, such as D3.js, are essential to the visualization community. However, slow SVG rendering can limit designs by effectively capping the number of on-screen data points, and this can force visualization creators to switch to Canvas or WebGL. These are less flexible (e.g., no search or styling via CSS), and harder to learn. We introduce Scalable Scalable Vector Graphics (SSVG) to reduce these limitations and allow complex and smooth visualizations to be created with SVG. SSVG automatically translates interactive SVG visualizations into a dynamic virtual DOM (VDOM) to bypass the browser's slow ‘to specification’ rendering by intercepting JavaScript function calls. De-coupling the SVG visualization specification from SVG rendering, and obtaining a dynamic VDOM, creates flexibility and opportunity for visualization system research. SSVG uses this flexibility to free up the main thread for more interactivity and renders the visualization with Canvas or WebGL on a web worker. Together, these concepts create a drop-in JavaScript library which can improve rendering performance by 3-9X with only one line of code added. To demonstrate applicability, we describe the use of SSVG on many example visualizations including published visualization research. A free copy of this paper, collected data, and source code are available at osf.io/ge8wp.
Materials
PDF | Preprint | DOI | Homepage | Supplement | Code | Demo Video | Video Presentation | BibTeXAuthors


Citation
Scalable Scalable Vector Graphics: Automatic translation of interactive SVGs to a multithread VDOM for fast rendering
Michail Schwab, David Saffo, Nicholas Bond, Shash Sinha, Cody Dunne, Jeff Huang, James Tompkin, and Michelle A. Borkin. IEEE Transactions on Visualization and Computer Graphics—TVCG. 2021. DOI: 10.1109/TVCG.2021.3059294
PDF | Preprint | DOI | Homepage | Supplement | Code | Demo Video | Video Presentation | BibTeX
Khoury Vis Lab — Northeastern University
* West Village H, Room 302, 440 Huntington Ave, Boston, MA 02115, USA
* 100 Fore Street, Portland, ME 04101, USA
* Carnegie Hall, 201, 5000 MacArthur Blvd, Oakland, CA 94613, USA