Stitching Meaning: Practices of Data Textile Creators
Abstract
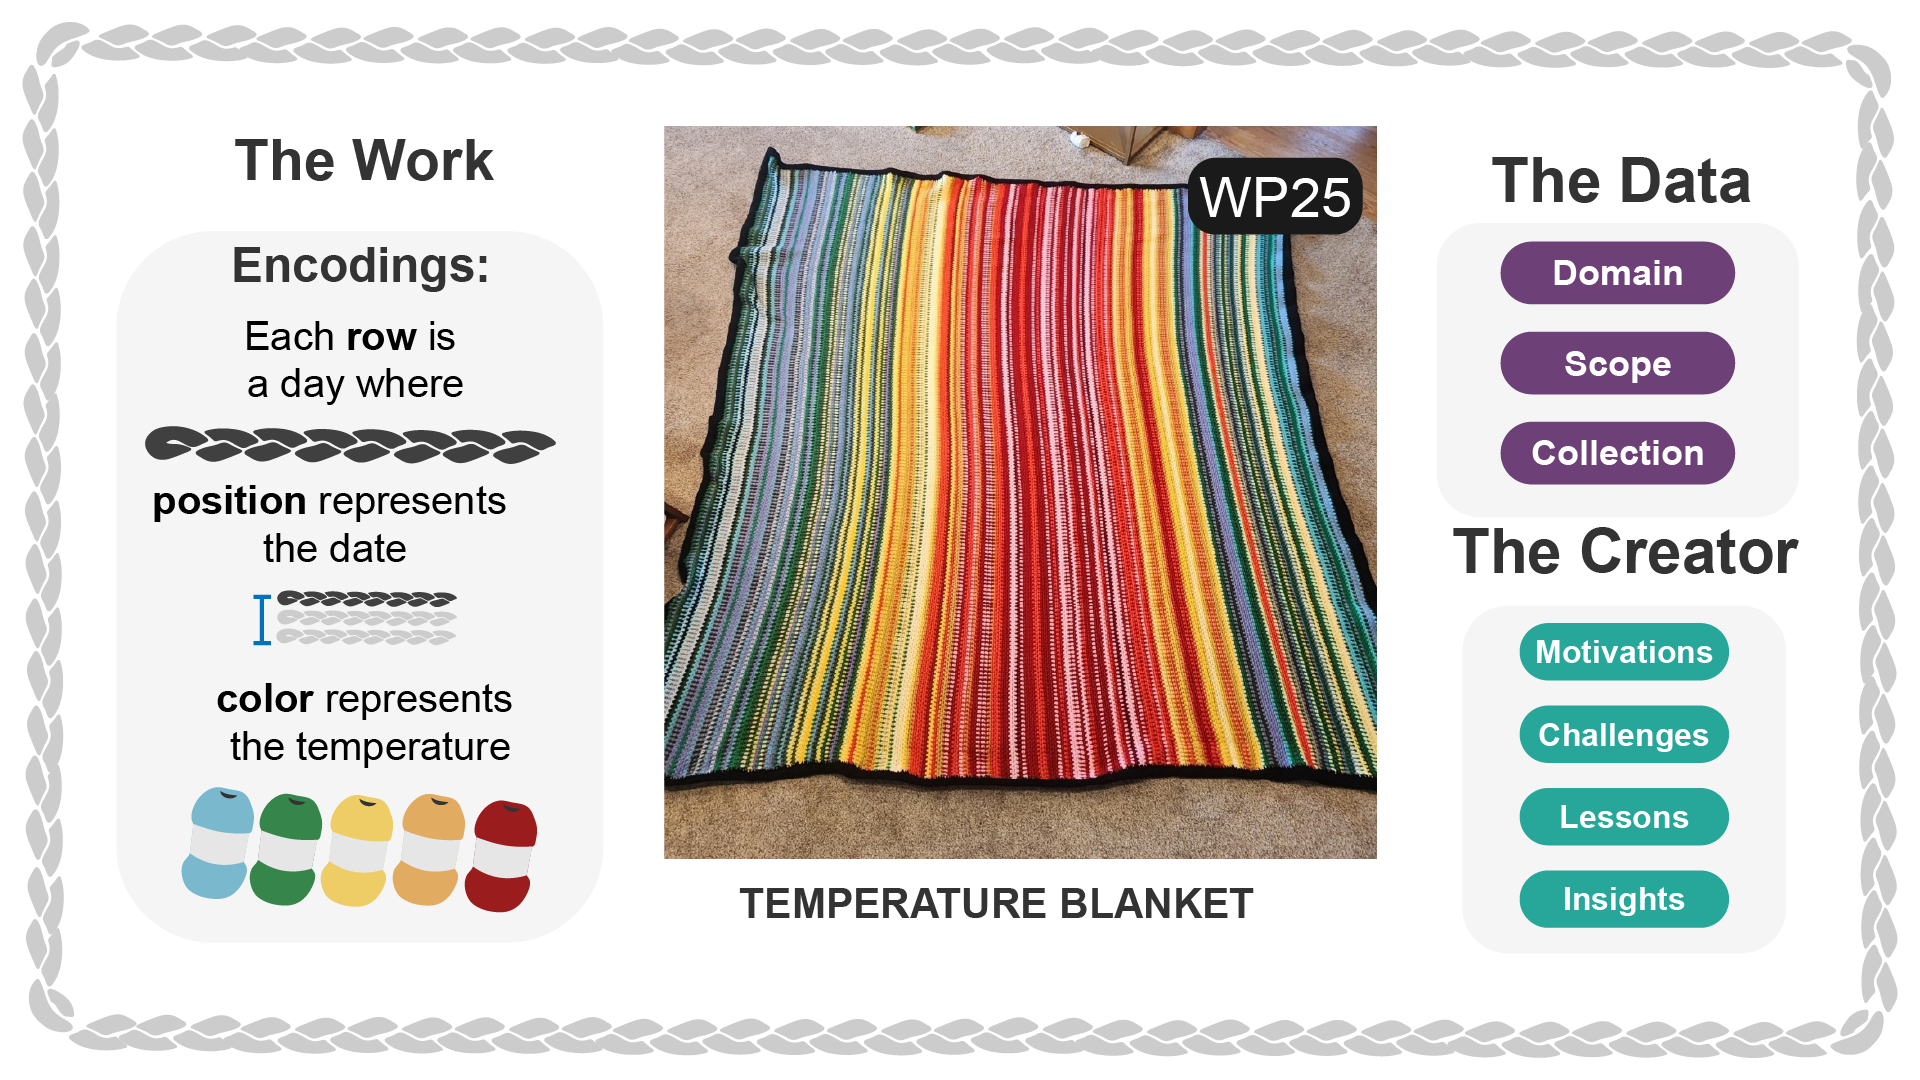
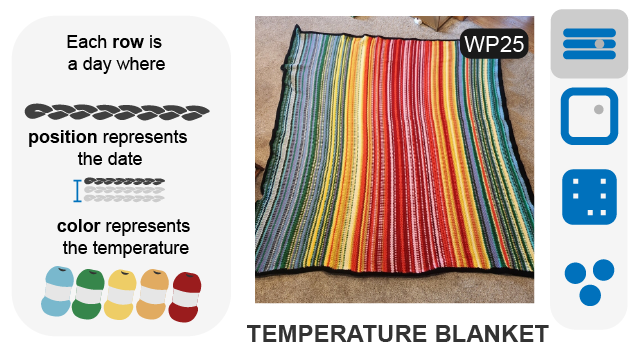
Tens of thousands of people have represented data by creating data-encoding textile pieces like blankets, scarves, and more. A prototypical example is the temperature blanket, which represents the weather through rows or blocks of different colors mapped to temperature ranges. While researchers have used fiber arts mediums to create exploratory projects, data visualization and physicalization research has largely not engaged with examples from this enormous and diverse community. We explore the space of data textiles, or fiber arts that encode information, by surveying creators (i.e., data fiber artists) on their projects and processes. We create a corpus of 159 examples of data textiles and present a schema characterizing the data encoding methods used in these projects. We also gather insights into creators’ data workflows as well as their motives and discoveries through making with their data. Creators of data textiles use distinct processes to map their data, building fabric from component structures and substructures while using material properties like color and texture. From diverse data-tracking procedures, creators use and relate to data in varied ways. Working on these pieces also contributes to the creators’ personal growth and data understanding. Our findings point to new opportunities for visualization, including opportunities to support fiber artists with tools formatted to their needs and opportunities to incorporate concepts from data textiles into other types of visualization (e.g., using texture, structural layouts, colorways).


Citation
Stitching Meaning: Practices of Data Textile Creators
Sydney Purdue, Eduardo Puerta, Enrico Bertini, and Melanie Tory. IEEE Transactions on Visualization and Computer Graphics—VIS/TVCG. 2025.
PDF | Preprint | Supplement | BibTeX
Khoury Vis Lab — Northeastern University
* West Village H, Room 302, 440 Huntington Ave, Boston, MA 02115, USA
* 100 Fore Street, Portland, ME 04101, USA
* Carnegie Hall, 201, 5000 MacArthur Blvd, Oakland, CA 94613, USA