MatplotAlt: A Python Library for Adding Alt Text to Matplotlib Figures in Computational Notebooks
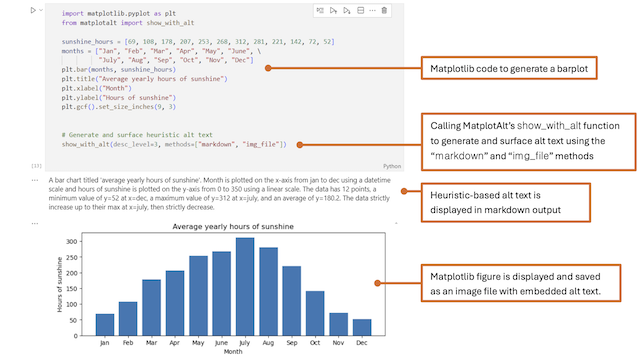
![A screenshot of a Jupyter notebook with annotations. At the top is a Python code cell with the annotation "Matplotlib code to generate a barplot". Below the Matplotlib code is the line show_with_alt(desc_level=3, methods=["markdown", "img_file"]). An annotation indicates this line is "calling MatplotAlt's show_with_alt function to generate and surface alt text using the 'markdown' and 'img_file' methods". Below the code cell is alt text for the generated bar plot in markdown, with the annotation "Heuristic-based alt text is displayed in markdown output". Finally, at the bottom of the figure is the generated barplot displaying average yearly hours of sunshine for each month. The last annotation indicates that this "Matplotlib figure is displayed and saved as an image file with embedded alt text".](/Image/paper/figure/Nylund2025MatplotAltPythonLibrary.png)
Abstract
We present MatplotAlt, an open-source Python package for easily adding alternative text to Matplotlib figures. MatplotAlt equips Jupyter notebook authors to automatically generate and surface chart descriptions with a single line of code or command, and supports a range of options that allow users to customize the generation and display of captions based on their preferences and accessibility needs. Our evaluation indicates that MatplotAlt’s heuristic and LLM-based methods to generate alt text can create accurate long-form descriptions of both simple univariate and complex Matplotlib figures. We find that state-of-the-art LLMs still struggle with factual errors when describing charts, and improve the accuracy of our descriptions by prompting GPT4-turbo with heuristic-based alt text or data tables parsed from the Matplotlib figure.
Authors

Citation
MatplotAlt: A Python Library for Adding Alt Text to Matplotlib Figures in Computational Notebooks
Kai Nylund, Jennifer Mankoff, and Venkatesh Potluri. Computer Graphics Forum—EuroVis/CGF. 2025. DOI: https://doi.org/10.1111/cgf.70119
Khoury Vis Lab — Northeastern University
* West Village H, Room 302, 440 Huntington Ave, Boston, MA 02115, USA
* 100 Fore Street, Portland, ME 04101, USA
* Carnegie Hall, 201, 5000 MacArthur Blvd, Oakland, CA 94613, USA