PDPilot: Exploring Partial Dependence Plots Through Ranking, Filtering, and Clustering
Abstract
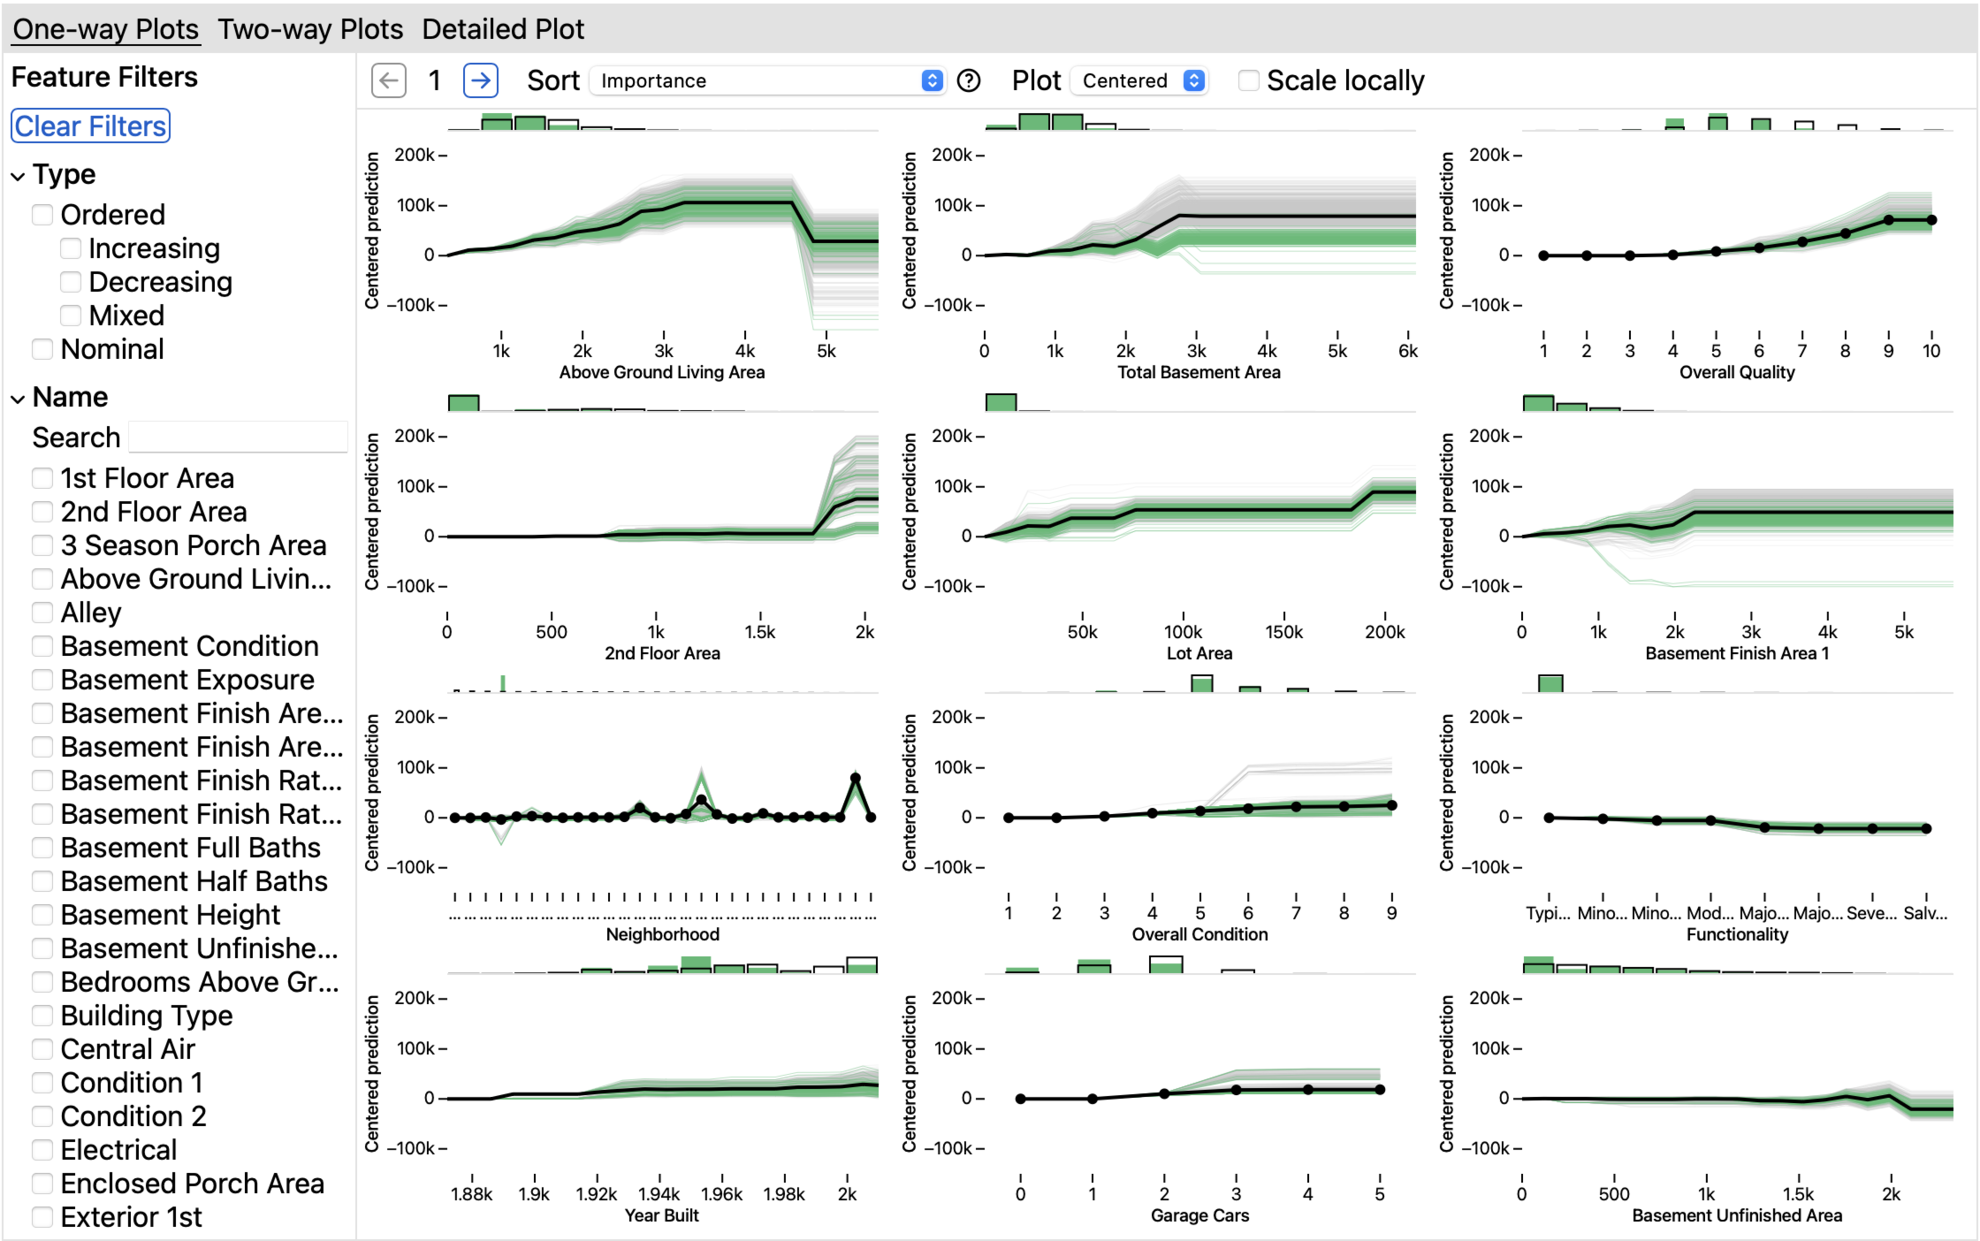
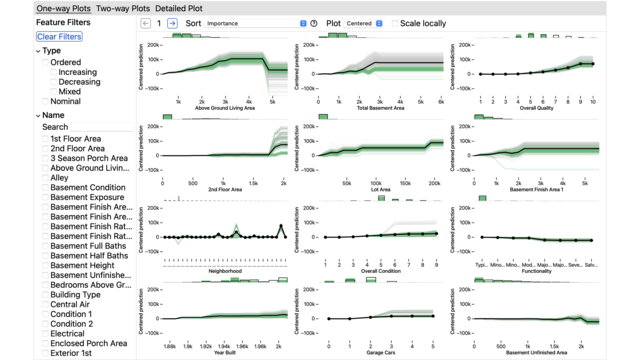
Partial dependence plots (PDPs) and individual conditional expectation (ICE) plots are visualizations used for explaining the behavior of machine learning (ML) models trained on tabular datasets. They show how the values of a feature or pair of features impact a model's predictions. However, in models with a large number of features, it is impractical for an ML practitioner to analyze all possible plots. To address this, we present new techniques for ranking and filtering PDP and ICE plots and build upon existing strategies for clustering the lines in ICE plots. Together, these techniques aim to help ML practitioners efficiently explore PDP and ICE plots and identify interesting model behavior. We integrate these techniques into PDPilot, a visual analytics tool that runs in Jupyter notebooks. We use PDPilot to study how 7 ML practitioners utilize the ranking, filtering, and clustering techniques to analyze an ML model.
Authors


Citation
PDPilot: Exploring Partial Dependence Plots Through Ranking, Filtering, and Clustering
Daniel Kerrigan, Brian Barr, and Enrico Bertini. IEEE Transactions on Visualization and Computer Graphics. 2025. DOI: 10.1109/TVCG.2025.3545025
GitHub | DOI | Demo video | User Study | Evaluations | BibTeX
Khoury Vis Lab — Northeastern University
* West Village H, Room 302, 440 Huntington Ave, Boston, MA 02115, USA
* 100 Fore Street, Portland, ME 04101, USA
* Carnegie Hall, 201, 5000 MacArthur Blvd, Oakland, CA 94613, USA