Impact of vertical scaling on probability density function plots
Abstract
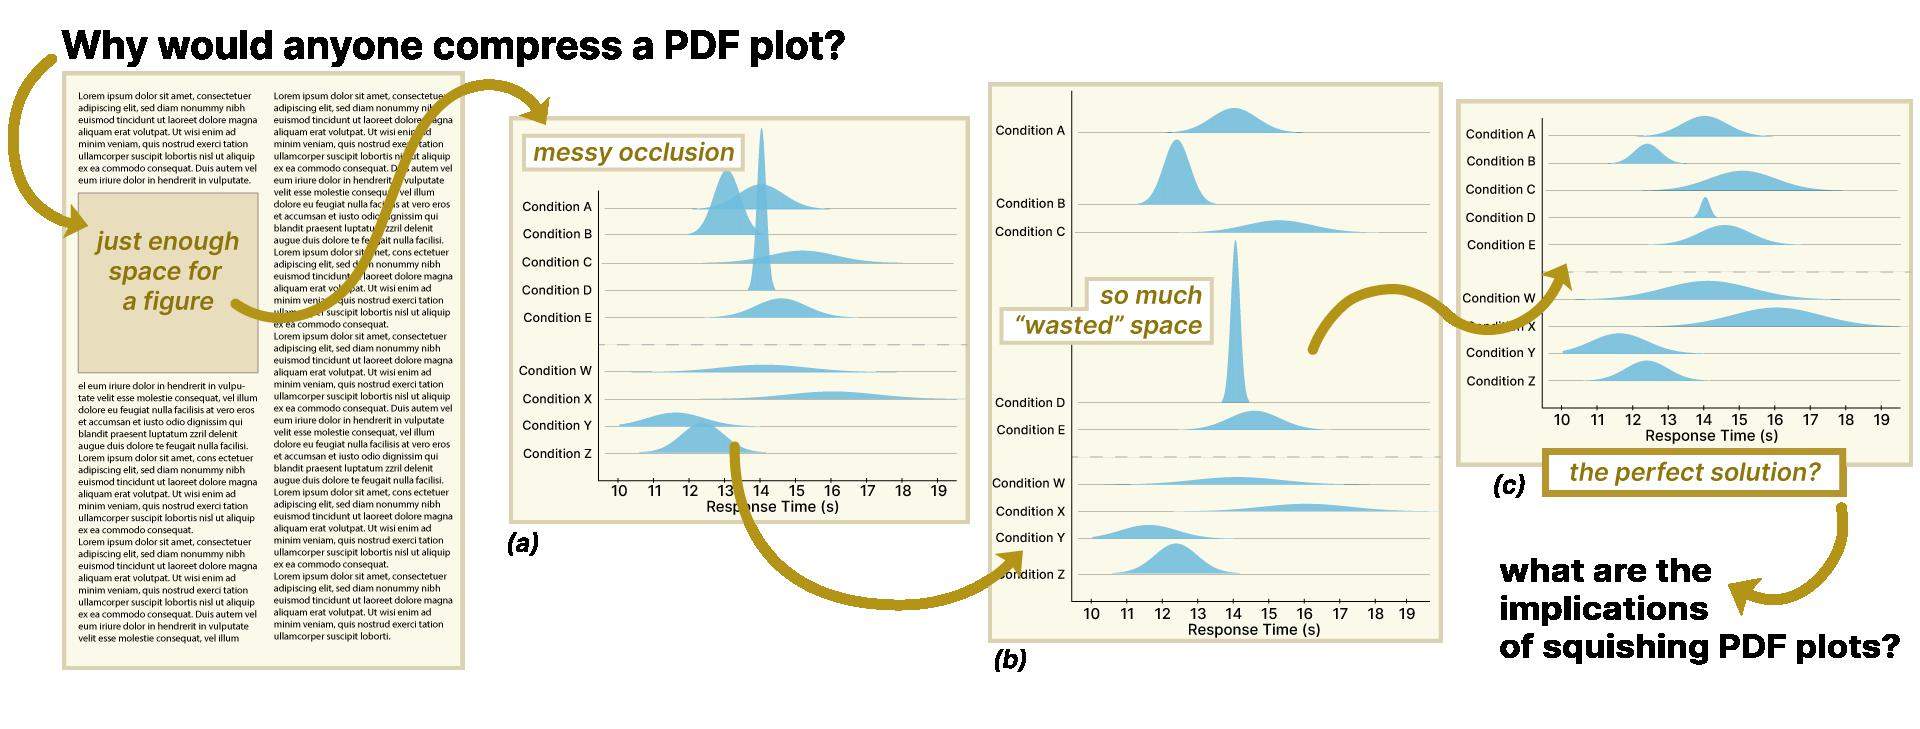
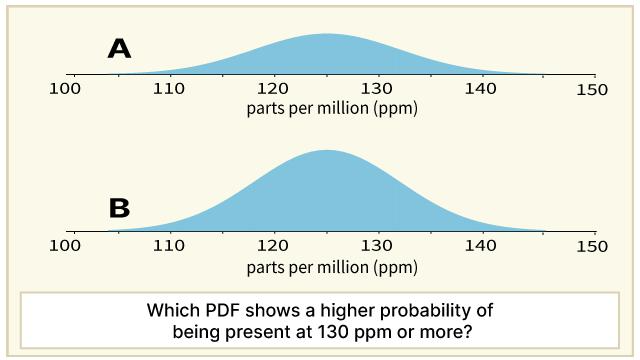
Probability density function (PDF) curves are among the few charts on a Cartesian coordinate system that are commonly presented without y-axes. This design decision may be due to the lack of relevance of vertical scaling in normal PDFs. In fact, as long as two normal PDFs have the same means and standard deviations (SDs), they can be scaled to occupy different amounts of vertical space while still remaining statistically identical. Because unfixed PDF height increases as SD decreases, visualization designers may find themselves tempted to vertically shrink low-SD PDFs to avoid occlusion or save white space in their figures. Although irregular vertical scaling has been explored in bar and line charts, the visualization community has yet to investigate how this visual manipulation may affect reader comparisons of PDFs. In this paper, we present two preregistered experiments (n = 600, n = 401) that systematically demonstrate that vertical scaling can lead to misinterpretations of PDFs. We also test visual interventions to mitigate misinterpretation. In some contexts, we find including a y-axis can help reduce this effect. Overall, we find that keeping vertical scaling consistent, and therefore maintaining equal pixel areas under PDF curves, results in the highest likelihood of accurate comparisons. Our findings provide insights into the impact of vertical scaling on PDFs, and reveal the complicated nature of proportional area comparisons.
Authors


Citation
Impact of vertical scaling on probability density function plots
Racquel Fygenson and Lace Padilla. IEEE Transactions on Visualization and Computer Graphics—VIS/TVCG. 2024.
PDF | Preprint | Supplement | Preregistration (Exp 1) | Preregistration (Exp 2) | BibTeX
Khoury Vis Lab — Northeastern University
* West Village H, Room 302, 440 Huntington Ave, Boston, MA 02115, USA
* 100 Fore Street, Portland, ME 04101, USA
* Carnegie Hall, 201, 5000 MacArthur Blvd, Oakland, CA 94613, USA