The worst graph layout algorithm ever
Abstract
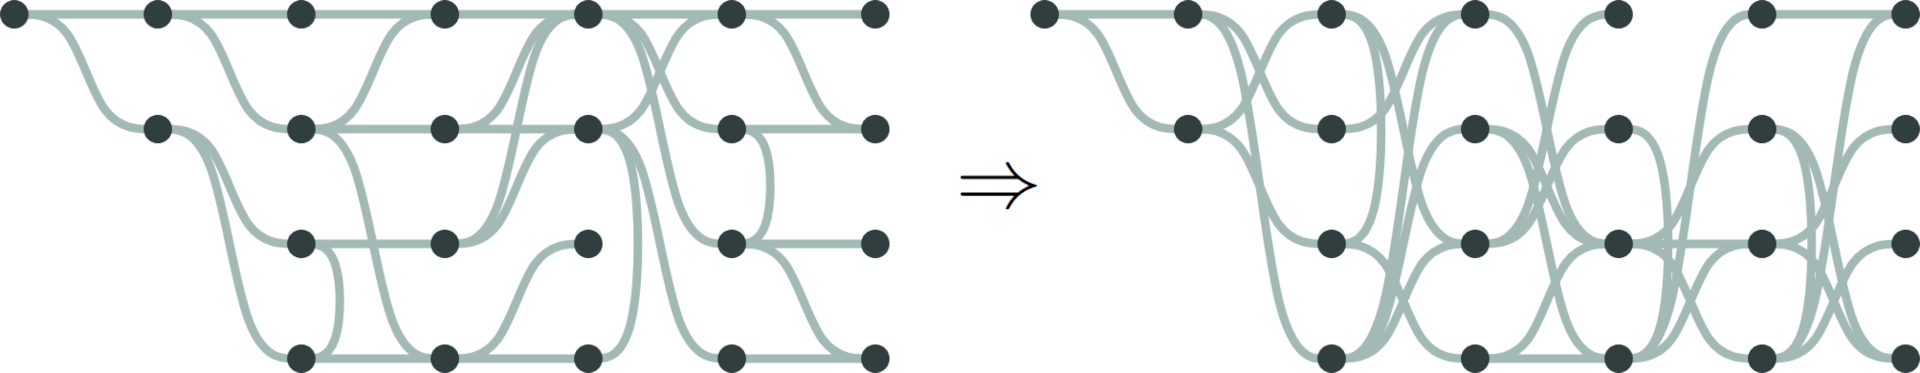
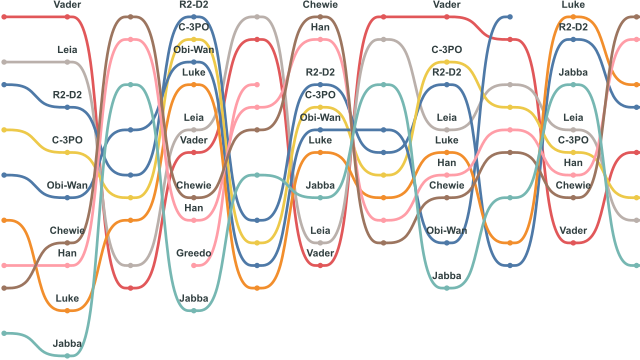
Graph layout algorithms strive to improve the utility of node-link visualizations or graph drawings by optimizing for readability criteria. One such criteria that has been widely used is to count edge crossings. Prior work has focused solely on minimizing the number of edge crossings, including provably-optimal layout algorithms for layered graphs. The research community has completely ignored the other side of the coin — can we optimally maximize edge crossings? This paper answers this question in the affirmative. Our WORSTisfimal layout algorithm produces the most unreadable layered graph drawing. It does so by using linear programming to produce a provably-optimally-awful solution. We hope that this groundbreaking result opens up an entirely new field of inquiry for graph drawing researchers — optimally-worst layout algorithms.
Materials
PDF | Preprint | DOI | Supplement | Award | BibTeX | alt.VIS 2022 The Worst (Algorithm) Award!Authors


Citation
The worst graph layout algorithm ever
Sara Di Bartolomeo, Matěj Lang, and Cody Dunne. Proc. alt.VIS workshop at IEEE VIS—alt.VIS. 2022. DOI: 10.31219/osf.io/4hfy9
PDF | Preprint | DOI | Supplement | Award | BibTeX | alt.VIS 2022 The Worst (Algorithm) Award!
Khoury Vis Lab — Northeastern University
* West Village H, Room 302, 440 Huntington Ave, Boston, MA 02115, USA
* 100 Fore Street, Portland, ME 04101, USA
* Carnegie Hall, 201, 5000 MacArthur Blvd, Oakland, CA 94613, USA