Gridded Visualization of Statistical Trees for High-Dimensional Multipartite Data in Systems Genetics

The image shows the Gridded Trees interactive interface for microbiome trait analysis. Panel A (top left) contains a Sankey diagram summarizing the structure of a conditional inference tree for the microbe Lactobacillus, illustrating how different microbial groups (e.g., Clostridiales, Staphylococcus, Butyricicoccus) connect to statistically determined mouse groups based on the trait "percent of time spent in the center of the chamber." Panel B (top right) features violin plots with overlaid strip plots, displaying the distribution of trait values for individual mice across various groups; an inset highlights hover tooltip functionality for identifying specific mice. Panel C (bottom) presents a grid of beeswarm and violin plots, each comparing microbe abundance within distinct groups at key tree nodes versus the overall experiment distribution. Solid black lines on these plots denote split values from the inference tree, and dashed gray lines indicate average microbe abundance for all mice. The layout visually integrates tree-based grouping, trait distribution, and microbe abundance comparisons.
The Gridded Trees interactive interface: A. The Sankey diagram summarizes the conditional inference tree structure for the selected microbe of interest (Lactobacillus) and trait (percent of time spent in the center of the chamber). B. Violin plots with strip plot overlays showing the trait values of mice, organized by statistically determined group. An inset illustrates hover tooltip interactivity (see Fig. 5 for all tooltips). C. A grid of small multiples comparing the microbe abundance for groups of mice at different nodes in the tree. Each beeswarm/violin plot compares microbe abundance for each group (multicolored beeswarm) to the overall distribution (gray violin), highlighting key differences. Black lines indicate “split values” derived from the conditional inference tree; gray dotted lines indicate the mean microbe abundance of all mice in the experiment.
Abstract
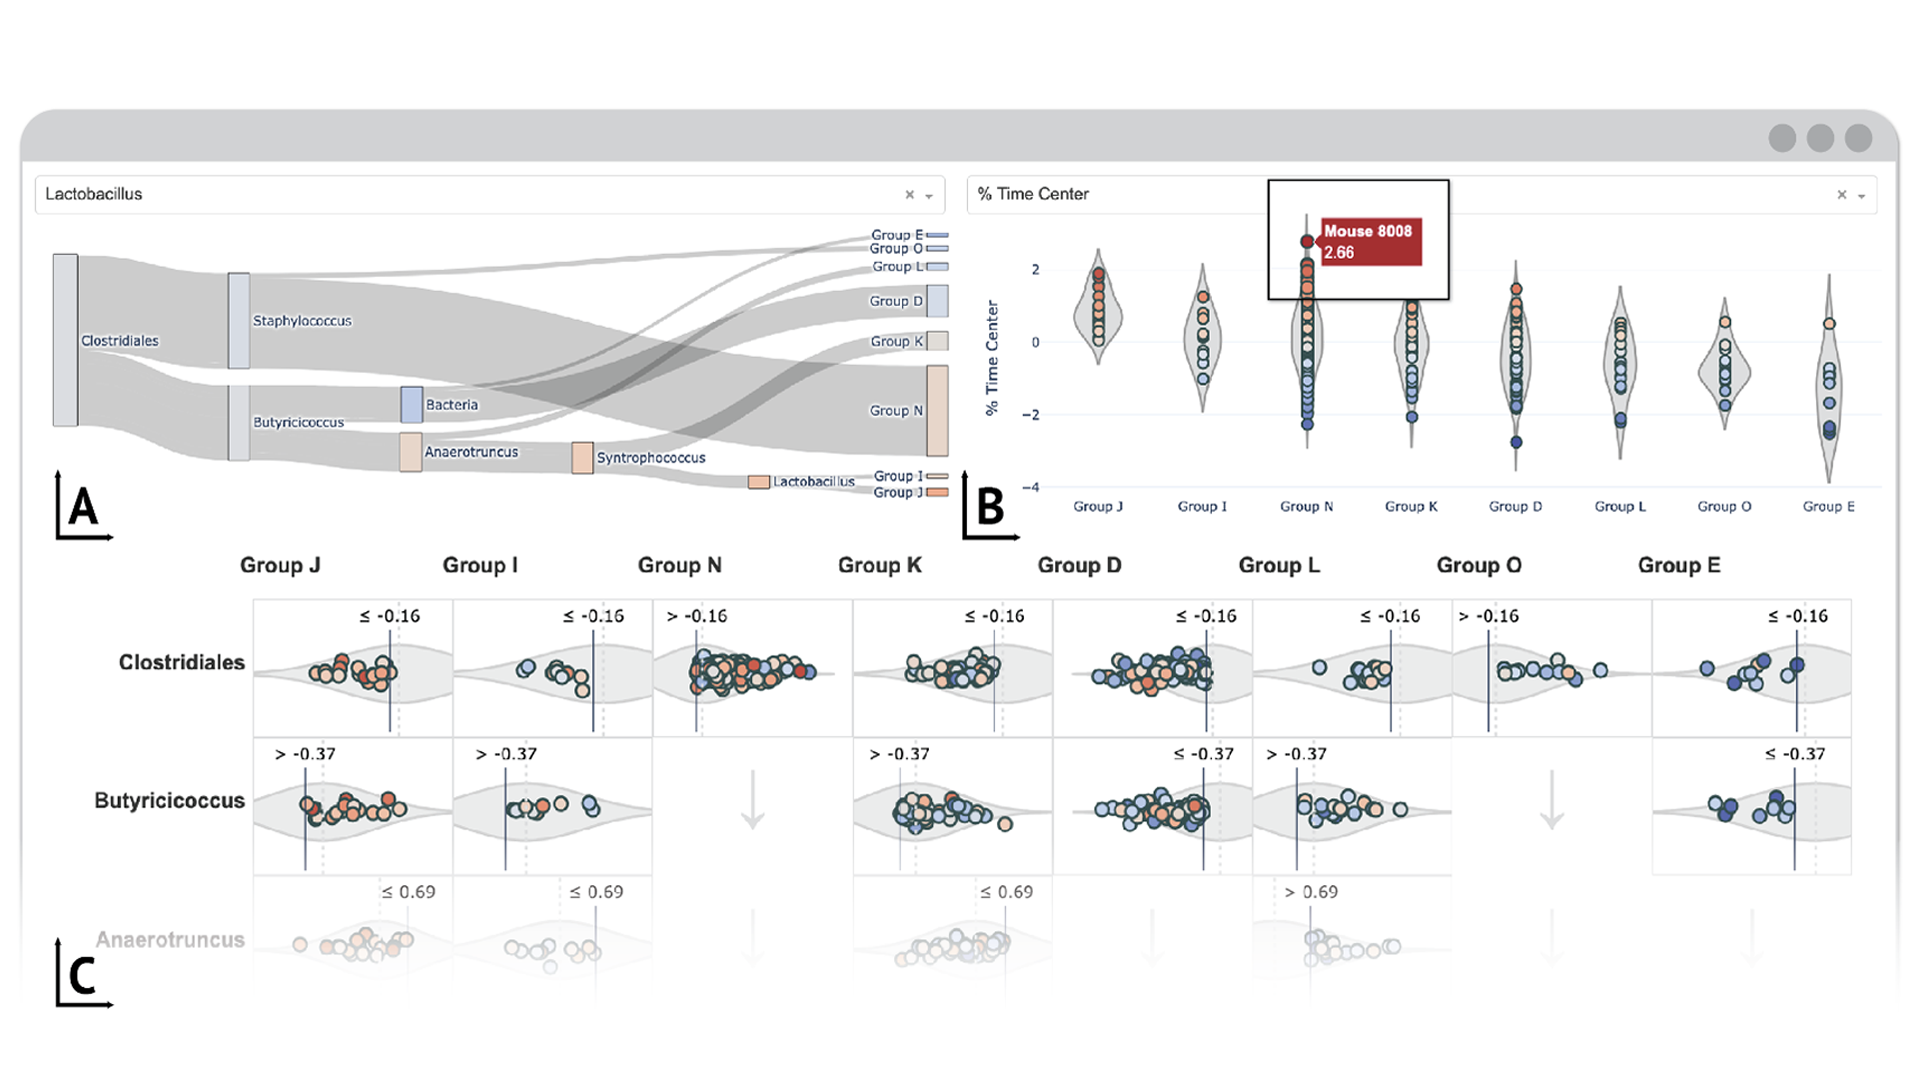
In systems genetics and other multi-omics research, exploring high-dimensional relationships among molecular and physiological variables across individuals poses significant challenges. We present the Gridded Trees interface, a novel interactive visualization tool designed to facilitate the exploration of conditional inference trees, which are hierarchical models of relationships in these complex datasets. Traditional static tools struggle to reveal patterns in tree-structured data, but the Gridded Trees interface provides interactive, coordinated views, allowing users to navigate between overview and detail, filter data dynamically, and compare molecular-physiological relationships across subgroups. By combining filtering techniques, strip plots, Sankey diagrams, and small multiples, the Gridded Trees interface enhances exploratory data analysis and supports hypothesis generation. In our systems genetics research use case, this tool has revealed significant associations among microbial populations and addiction-related behavioral traits in genetically diverse mice. The Gridded Trees interface suggests broad potential for visualizing hierarchical and multipartite data across domains.
Materials
PDF | Preprint | DOI | Supplement | Code | Presentation Slides | BibTeX | EuroVis Best Paper Honorable Mention!
Authors
Robyn L. Ball
Jason A. Bubier
Elissa J. Chesler
Citation
Thumbnail image for publication titled: Gridded Visualization of Statistical Trees for High-Dimensional Multipartite Data in Systems Genetics
Gridded Visualization of Statistical Trees for High-Dimensional Multipartite Data in Systems Genetics

Jane Lydia Adams, Robyn L. Ball, Jason A. Bubier, Elissa J. Chesler, Melanie Tory, and Michelle A. Borkin. Computer Graphics Forum—EuroVis/CGF. 2025. DOI: 10.1111/cgf.70113

PDF | Preprint | DOI | Supplement | Code | Presentation Slides | BibTeX | EuroVis Best Paper Honorable Mention!


Khoury Vis Lab — Northeastern University
* West Village H, Room 302, 440 Huntington Ave, Boston, MA 02115, USA
* 100 Fore Street, Portland, ME 04101, USA
* Carnegie Hall, 201, 5000 MacArthur Blvd, Oakland, CA 94613, USA